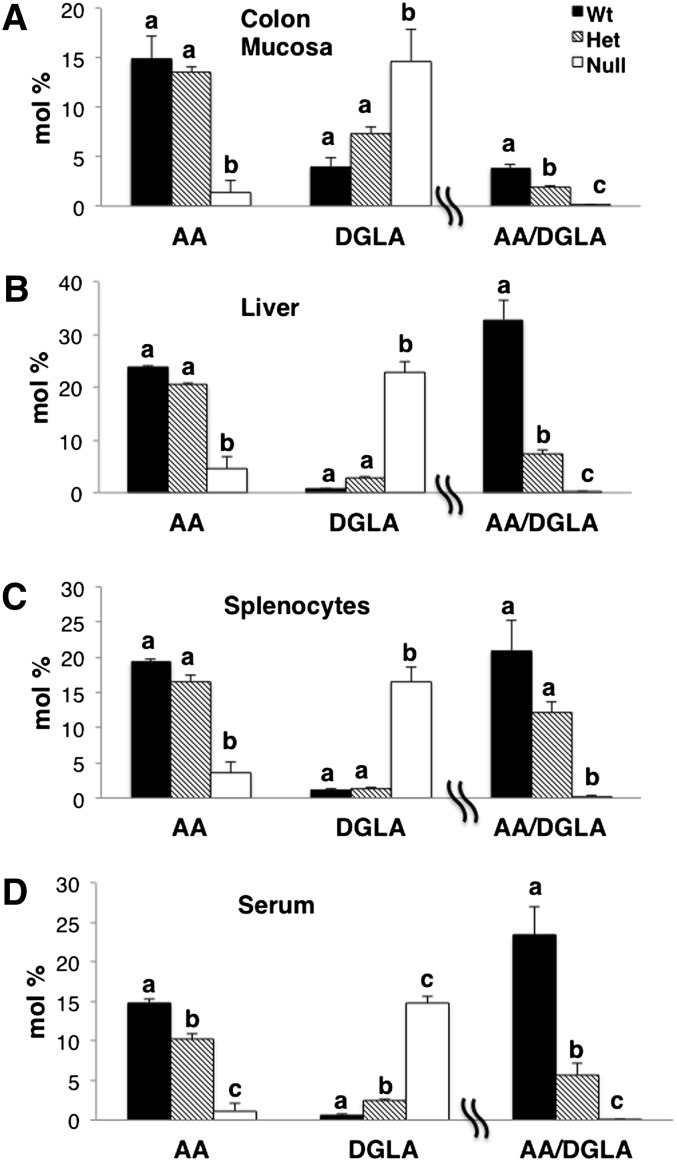
Fig. 4.
Tissue levels of AA and DGLA. Total phospholipids were isolated from mouse (A) colon mucosa, (B) liver, (C) splenocytes, and (D) serum, and fatty acid profiles were measured by GC-MS; mean ± SEM, n = 3. Values not sharing the same letter indicate a significant difference within respective fatty acids (P < 0.05).

