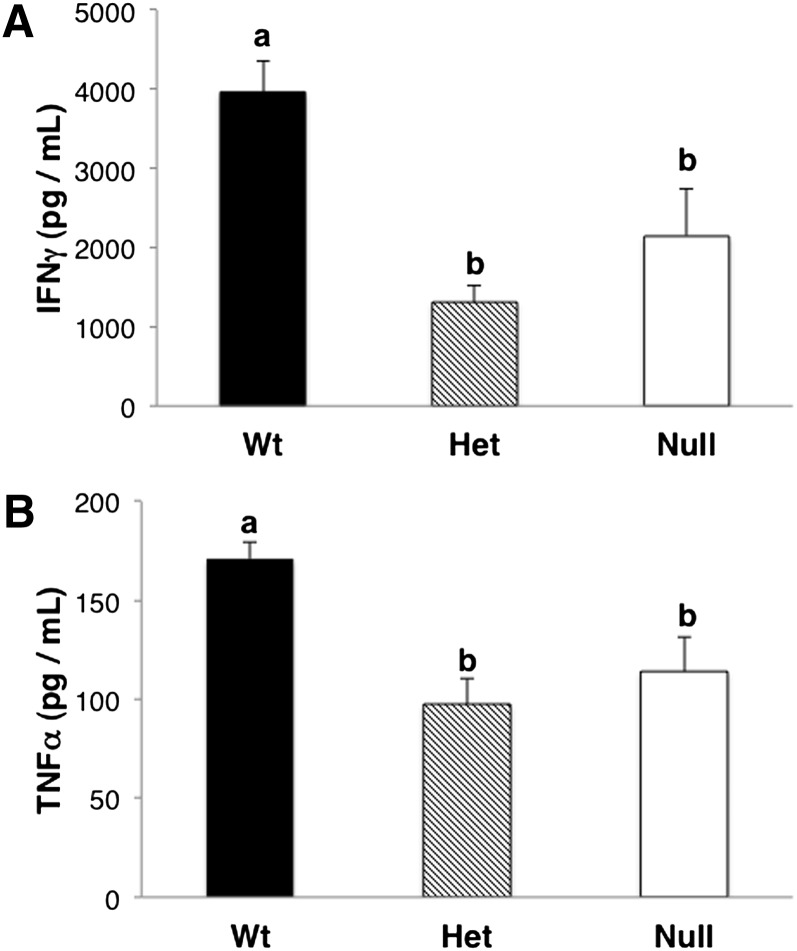
Fig. 9.
Levels of T-cell-derived inflammatory cytokines. T cells were isolated from pooled spleens and mesenteric and inguinal lymph nodes, and then stimulated with 5 μg/ml of plate-bound anti-CD3 plus 20 μg/ml of soluble anti-CD28 for 24 h. Culture supernatants were collected, and cytokine levels were measured using a Bio-Plex 200 System (Bio-Rad). Only selected cytokines are shown; mean ± SEM, n = 3. Values not sharing the same letter indicate significant differences (P < 0.05).

