Fig. 3.
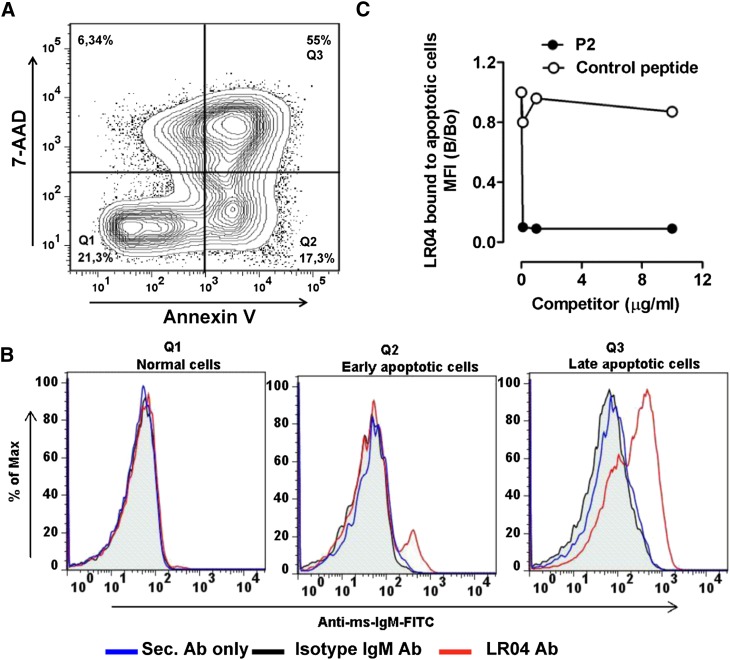
Mimotopes mimic MDA epitopes on apoptotic cells. (A) Representative flow cytometry plot of apoptotic Jurkat T-cells. Apoptosis of Jurkat T-cells was induced by 20 mJ/cm2 UV irradiation, and cells were stained with PE-labeled Annexin-V and 7-AAD to determine Annexin-V− 7-AAD− viable cells (Q1), Annexin-V+ early apoptotic (Q2) and Annexin-V+ 7-AAD+ late (Q3) apoptotic cells. (B) Representative flow cytometry histogram plot for the binding of apoptotic cells by LRO4. Apoptotic cells were induced as described in panel A and stained with either LRO4, isotype IgM, or no primary Ab, followed by detection using a FITC-conjugated anti-mouse IgM Ab as “secondary Ab” (Sec. Ab). Subsequently, cells were stained with PE-labeled Annexin-V and 7-AAD. The left panel represents staining of viable cells (Q1), the middle panel staining of early apoptotic cells (Q2), and the right panel staining of late apoptotic cells (Q3). (C) Inhibition of LRO4 binding to apoptotic cells by P2. Apoptotic cells were stained with LRO4 in the absence or presence of increasing amounts of P2 or an irrelevant control peptide, as indicated. Data represent the ratio of LRO4 binding as mean fluorescence intensity (MFI) obtained in the presence or absence of competitors (B/B0). Results are representative of two independent experiments.

