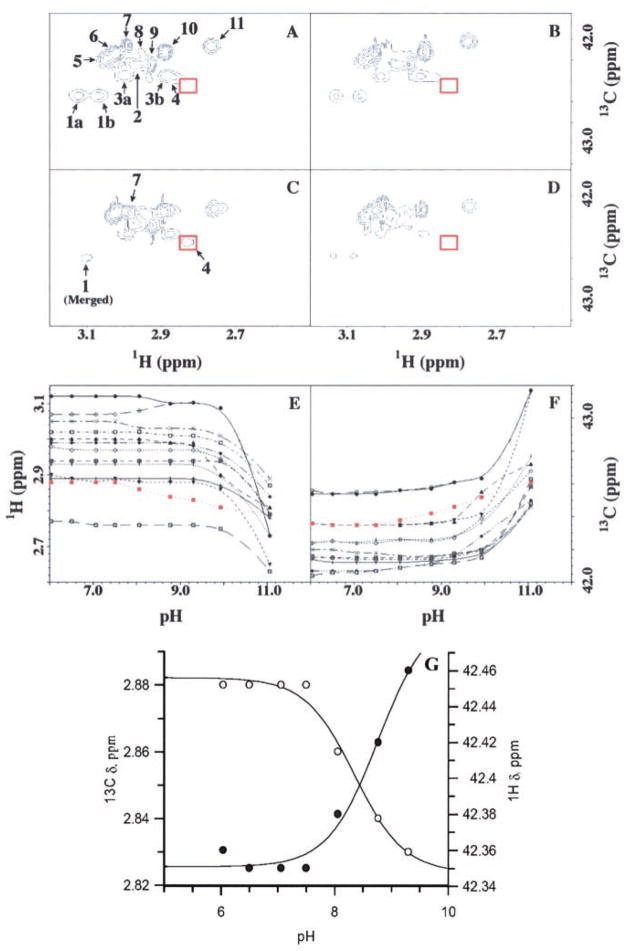
Fig. 2. 13C HSQC spectra for wild-type and K73A mutant TEM-1 β-lactamase, specifically 13C labeled at the C(ε) position, and the corresponding 1H-13C(ε) chemical shifts from all lysines for the wild-type protein, obtained from the pH titration.
Spectral features are labeled in panel A. The wild-type spectra at pH 6.0 (A) and pH 9.3 (C), and those of the K73A mutant protein at pH 6.0 (B) and pH 9.3 (D) are depicted. Red boxed areas designate the position (or lack thereof) for peak 4, attributed to the Lys-73 signal. Chemical shifts of proton (E) and carbon (F) as a function of pH for all lysine H2C(ε) resonances. The profile for peak 4 is shown in red. Peak labels are as follows: Peaks 1a (●), 1b (○), 2 ([+]), 3a (▲), 3b (▼), 4 (■), 5 (×), 6 (□), 7 (◆), 8 (⊙),9 (¦), 10 (+), and 11 (\). G, the NMR chemical shifts of the proton and carbon for peak 4 (E and F) were fitted to a single-ionization model (Equation 2).

