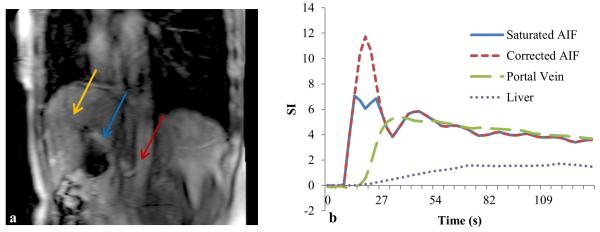
Figure 2.
A slice of DCE-MRI of a patient (Figure a) and the contrast concentration-time curves of the original and corrected AIFs, the portal venous input and the liver parenchyma (Figure b). The first pass of the original AIF shows 42% saturation compared with the corrected one. Arrows in left panel mark locations of aorta, portal vein and liver voxels where the contrast concentration-time curves are obtained.

