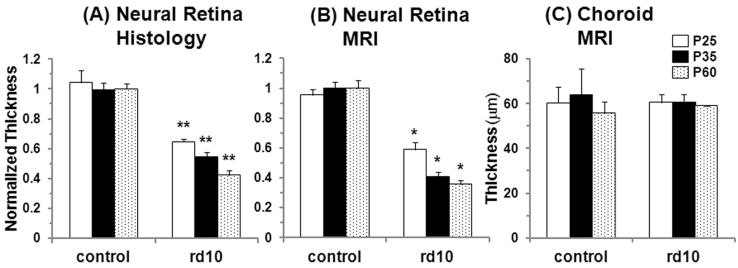
Figure 3.
Group-averaged normalized thicknesses of the neural retina from (A) histology and (B) anatomical MRI (sum of MRI layers 1, 2, and 3) at 42×42×400μm from control and rd10 mice at P25, P35, and P60. (C) Group-averaged absolute thicknesses of the choroid from anatomical MRI (MRI layer 4). Error bars represent SD. *p<0.01 compared to age-matched control mice, **p<1E-6 compared to age-matched control mice. From MRI, P35 and P60 rd10 mice also had significantly thinner retinas compared to P25 rd10 mice, p<0.01. From histology, P60 rd10 mice had significantly thinner retinas compared to P25 and P35 rd10 mice, p<0.01, and P35 rd10 mice had thinner retinas compared to P25 rd10 mice, p<0.05.

