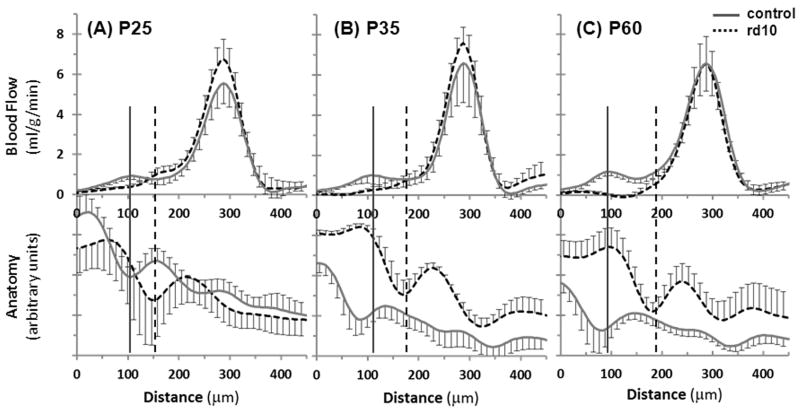
Figure 5.
Group average BF (top) and anatomical (bottom) profiles from control and rd10 mice at (A) P25, (B) P35, and (C) P60 (n=6 control and 6 rd10 at each age). The anatomical profiles come from the EPI images that the BF profiles were calculated from (and not from the bSSFP images) and were not intensity normalized. Error bars represent SD. The solid vertical lines indicate the approximate location of rBF in controls, and the dashed vertical lines indicate rBF in rd10 mice.

