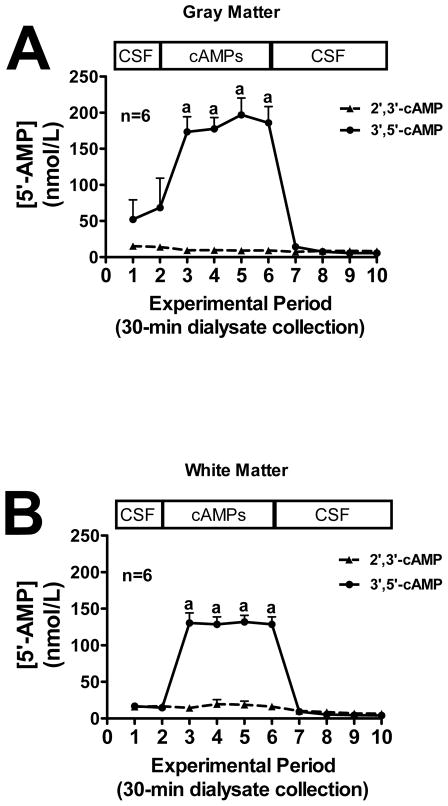
Figure 3.
Line graphs depict the effects of administering 2′,3′-cAMP or 3′,5′-cAMP via the inflow perfusate of a microdialysis probe on 5′-AMP levels in the outflow perfusate of the probe in mouse brain gray matter (A) or white matter (B) tracts. “a” indicates significantly different from experimental periods 1, 2, 8, 9 and 10 in the 2′,3′-cAMP treatment group. Values represent mean ± SEM.

