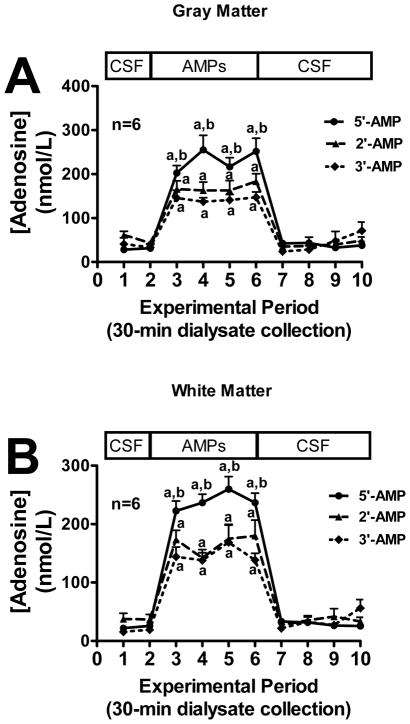
Figure 5.
Line graphs depict the effects of administering 2′-AMP, 3′-AMP or 5′-AMP via the inflow perfusate of a microdialysis probe on adenosine levels in the outflow perfusate of the probe in mouse brain gray matter (A) or white matter (B) tracts. “a” indicates significantly different from experimental periods 1, 2, 7, 8, 9 and 10 in the corresponding treatment group. “b” indicates significantly different from 2′-AMP and 3′-AMP at the corresponding period. Values represent mean ± SEM.

