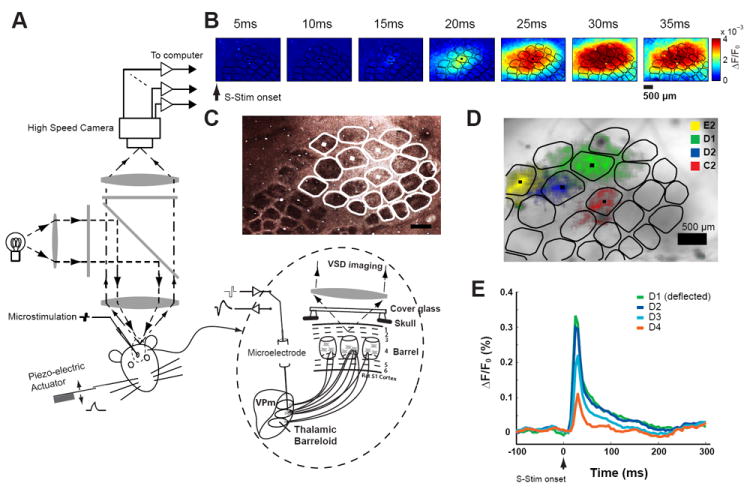
Figure 1.

Voltage Sensitive dye imaging of cortical activation in response to thalamic activation and whisker deflection. A) Diagram of optical imaging setup. B) Example of cortical response to a punctate deflection of whisker D2 (sensory stimulation, S-Stim). C) Example of barrel columns shown in a CO stained brain slice. White traces are contours of the barrel columns shown in Figure 1D. D) Barrel mapping by registering the histologically identified barrel map with functional columns. E) Mean activation within nearby cortical columns D1, D2, D3, and D4 following the punctate deflection of the D1 whisker. Scale bars in B, C and D are 500um.
