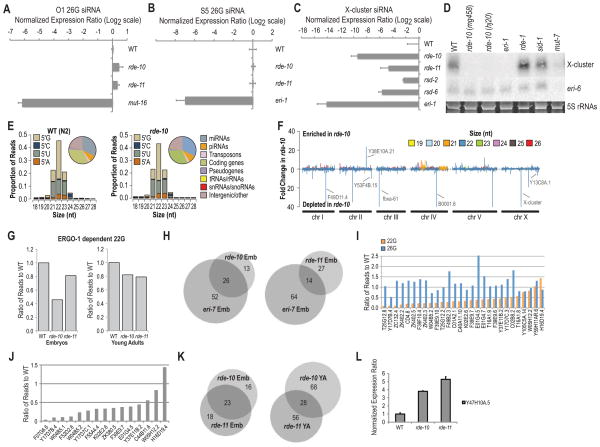
Figure 4.
rde-10 and rde-11 genes regulate the levels of a subset of WAGO class 22G siRNAs. (A) Ratio of O1 26G siRNA in rde-10 and rde-11 mutant embryos to WT after log2 transformation as determined by Taqman qRT-PCR (WT = 0; i.e., Log2 1.0). Total RNA extracted from mut-16 was used as a negative control. miR-35 was used for normalization. (B) Ratio of S5 26G siRNA in rde-10 and rde-11 mutant L4 larvae/young adults to WT after log2 transformation as determined by Taqman qRT-PCR (WT = 0; i.e., Log2 1.0). Total RNA extracted from eri-1 was used as a negative control. let-7 was used for normalization. (C) Ratio of X-cluster siRNA in various mutant strains at the adult stage to WT after log2 transformation as determined by Taqman qRT-PCR (WT = 0; i.e., Log2 1.0). Total RNA extracted from eri-1 was used as a negative control. miR-1 was used for normalization. All error bars are standard deviations calculated from three technical replicates. (D) Northern blot assays of X-cluster and eri-6 (T01A4.3) siRNAs. 5S rRNAs stained with ethidium bromide are shown as a loading control. Total RNAs were extracted from day one gravid adult worms. eri-1 mutant was used as a negative control for X-cluster siRNA expression, while mut-7 mutant was used as a negative control for X-cluster and eri-6 (T01A4.3) siRNA expression. (E) Small RNA size and 5′ nucleotide distribution in WT and rde-10 mutant day one gravid adult worms. (Insets) Pie charts display the proportion of reads corresponding to the indicated features. (F) Enrichment or depletion of small RNAs in rde-10 mutant worms relative to WT worms. Total small RNA reads were calculated for 5 kb bins in 1 kb increments across each chromosome. (G) Ratio of 22G siRNA reads derived from ERGO-1 class 26G siRNA target mRNAs in rde-10 and rde-11 mutants to WT (WT = 1.0) at embryo and L4 larvae/young adult stages. (H) Venn diagrams of rde-10, rde-11 and eri-7 dependent siRNAs. (I) Ratio of NRDE-3 class 22G and upstream ERGO-1 class 26G siRNA reads in rde-10 embryos to WT embryos (WT = 1.0) (J) Ratio of RRF-3 dependent 22G siRNA reads from somatic target mRNAs in rde-10 and rde-11 mutant embryos to WT embryos (WT = 1.0). (K) Venn diagrams of rde-10 and rde-11 dependent siRNAs at embryo and L4 larvae/young adult stages. (L) Ratio of Y47H10A.5 target mRNA levels in rde-10 and rde-11 mutants to WT (WT = 1.0) as determined by qRT-PCR. All error bars are standard deviations calculated from three technical replicates. See also Figure S2 and Tables S2-S7.

