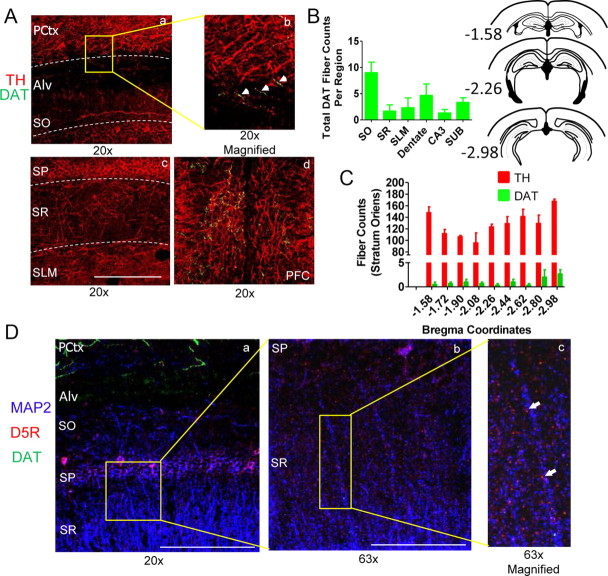
Figure 2.
TH-positive staining is observed throughout the CA1 region of hippocampus while DAT-positive staining is sparse. Aa, Ab, Ac, Confocal images acquired using a 20× objective show dense TH fiber staining throughout the CA1 region of hippocampus (SP, stratum pyramidale; SO, stratum oriens; SR, stratum radiatum; SLM, stratum lacunosum moleculare), overlying parietal cortex (PCtx) and alveous (Alv) with DAT staining observed only in PCtx and Alv. Ad, Image shows TH and DAT staining in the PFC region. Bars represent 0.5 mm (20× magnification). B, Left, Plot shows total DAT-positive fiber counts across AP coordinates −1.58 to −2.98 from CA1, CA3, dentate, and subiculum (SUB) with the most dense staining observed in SO region of CA1 (SO, 9 ± 2; SR, 1.7 ± 1.2; SLM, 2.3 ± 1.9; Dentate, 4.7 ± 2.2; CA3, 1.3 ± 0.7; SUB, 3.3 ± 0.9; n = 3 mice). B, Right, Coronal sections from AP −1.58 to −2.98. C, Total TH and DAT-positive fiber counts at each AP coordinate from −1.58 to −2.98 from the SO region of CA1 show TH fibers surpass DAT fiber density by ∼100× (TH, 127 ± 4 fibers; DAT, 1 ± 0.3 fibers; p < 0.0001; n = 3 mice). Error bars indicate SEM. D, Confocal images of CA1 show MAP2 (blue), DAT (green), and dopamine D5 receptors (D5Rs; red) at 20×, 63×, and 63× × 150% (digital) magnification. Bars represent 0.5 mm (20× magnification) and 0.15 mm (63×). Images indicate D5R staining is observed throughout the CA1 region and is localized to sites adjacent to CA1 pyramidal cell dendrites such as postsynaptic spines while DAT staining is isolated to the overlying cortical region.

