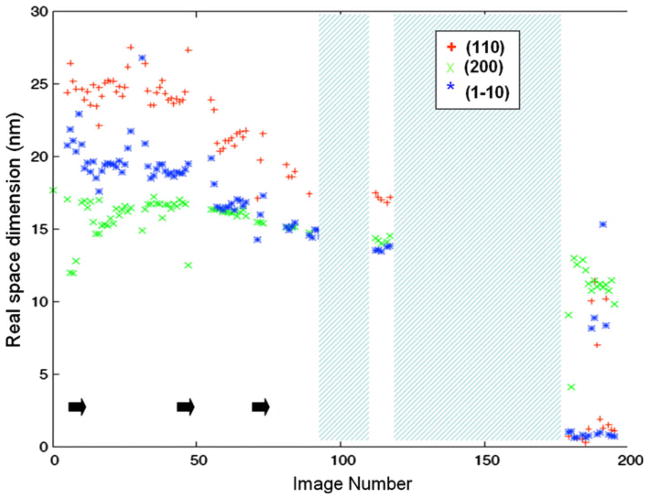
Fig. 4.
Real space dimensions determined from the radial widths of the (1–10), (110) and (200) reflections of cellulose I for each detector image. Points during the transition at which EDA was dropped onto the sample are indicated by black arrows. Periods during which the sample was removed and soaked in EDA are represented by cross-hatched areas

