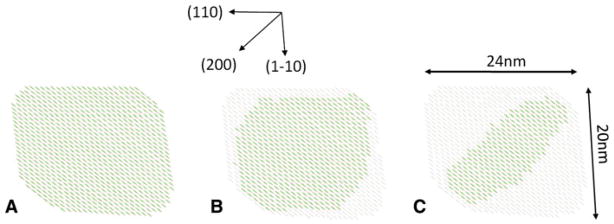
Fig. 7.
Schematic representation of the average of the cross sectional shapes of the cellulose I crystals (black regions) at (a) the start of the transition (b) at around the 50/50 point during the transition (c) towards the end of the transition. Regions that no longer correspond to crystalline cellulose I are represented in a lighter shade

