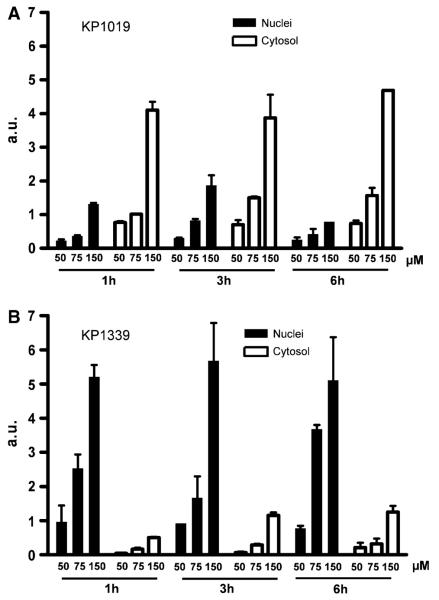
Fig. 4.
Drug accumulation and intracellular drug distribution. Cytosolic and nucleic ruthenium levels of a KP1019- and b KP1339-treated KB-3-1 cells were determined after 1-, 3-, and 6-h drug exposure by inductively coupled plasma mass spectrometry (ICP-MS). The values given are relative means and the SD from at least two independent experiments

