
Fig. 6.
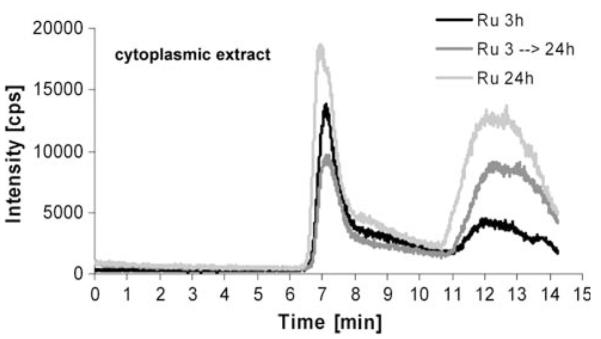
Drug–protein binding patterns of KP1019 in pulsing experiments. KB-3-1 cells were treated with 50 μM KP1019, and after 3-h drug exposure drug-containing medium was replaced with fresh, drug-free cell culture medium. SEC-ICP-MS of cytosolic fractions was performed 24 h after the beginning of the experiment. Cytosolic fractions of cells treated for 3 and 24 h were prepared and analyzed in parallel. The respective cell numbers for the experiment were 1.58 × 10⁷, 3.2 × 10⁷, and 2.95 × 10⁷ for the 3-, 3–24-, and 24-h samples