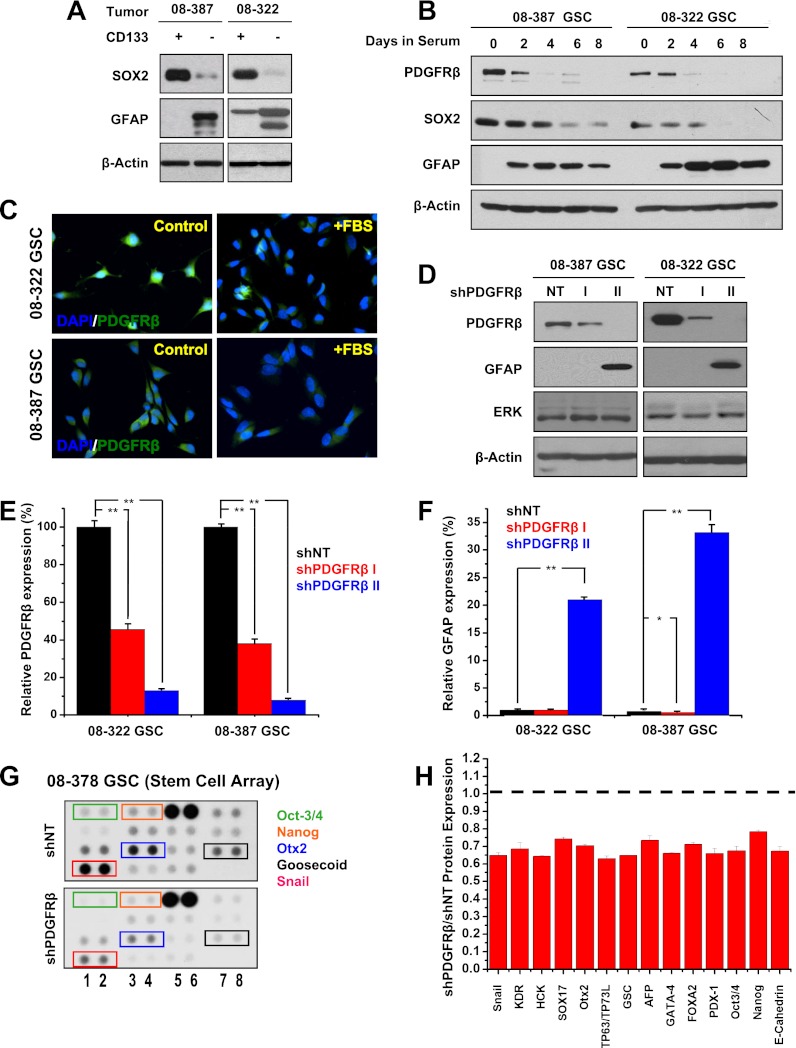
Figure 2.
PDGFRβ and GSC marker expression correlate. (A) Sox2 and GFAP protein expression in GSCs and GBM nonstem cells determined via Western confirmed differences in the expression of these stem and differentiation markers. (B) PDGFRβ, Sox2, and GFAP expression monitored using Western after FBS addition demonstrated PDGFRβ and Sox2 decreased while GFAP increased with differentiation. (C) Immunofluorescence demonstrated that PDGFRβ expression decreased after differentiation. (D) PDGFRβ knockdown was confirmed via Western after introduction of two different PDGFRβ shRNAs (shPDGFRβ I and shPDGFRβ II) in comparison with nontargeting (NT) control. PDGFRβ knockdown associated with increased GFAP expression. (E) Efficiency of PDGFRβ knockdown was quantitatively measured by real-time PCR after exposure to lentivirus expressing shPDGFRβ I, shPDGFRβ II, or a nontargeting control shRNA (shNT). (F) Real-time PCR demonstrated increased expression of the astrocyte differentiation marker GFAP in cells with shPDGFRβ II. (G) Representative image of stem cell arrays after exposure to lysate from GSCs expressing nontargeting shRNA (shNT) or shPDGFRβ demonstrating decreased levels of many stem factors after PDGFRβ knockdown. (H) Quantification of the relative expression of stem cell factors in shPDGFRβ versus nontargeting shRNA (shNT).

