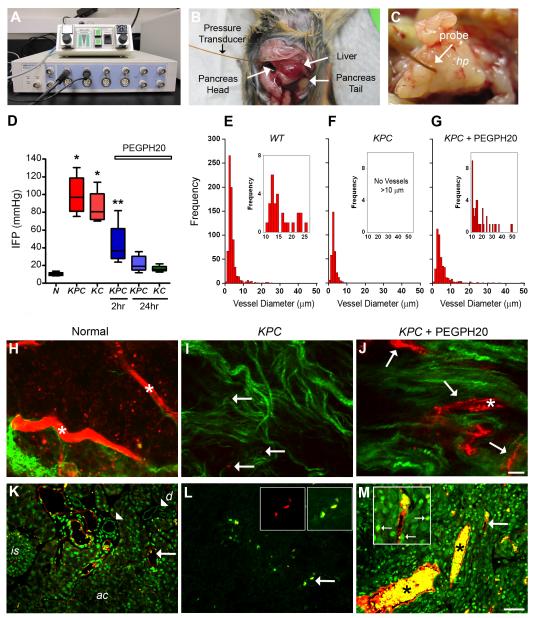
Figure 2. Elevated IFP compromises vascular function in PDA.
(A) Experimental apparatus to measure IFP.
(B and C) IFP probe positioned in PDA at the head of the pancreas (hp). In (B) the probe ends in a tumor obscured by the overlying liver.
(D) IFP measurements in normal pancreata (N), untreated KPC and KC tumors and tumors 2 and 24 hours post-PEGPH20 treatment. *p<0.01 for difference between normal pancreata and PEGPH20 treatment groups; **p<0.05 for difference from all other groups with 1-way ANOVA and Newman-Keuls post-hoc multiple comparison test. Note that IFP levels in normal pancreata and PEGPH20-treated KC (mean = 16 mmHg, n = 4) and KPC (mean = 22 mmHg, n = 5) tumors 24 hours post-treatment were not statistically different. Box and whisker plots: boxes display the lower (25th) and upper (75th) quartiles with a line at the median; whiskers extend from the minimum to the maximum observation.
(E-G) Distribution of CD31+ vessel diameter in normal pancreata (E), untreated KPC tumors (F), and KPC tumors 24 hours post-PEGPH20 treatment (G). Insets show data for vessels of diameter >10 μm. Data represent evaluations from four independent sections from each of four separate animals for each condition and are significantly different (p<0.0001) in the pairwise comparisons with KPC.
(H-J) Multiphoton excitation of fluorescently-conjugated lectin (red) and second harmonic generation imaging of collagen (green) within intact normal pancreas (H), untreated KPC tumors (I), and KPC tumors 24 hours post-PEGPH20 treatment (J). Asterisks in (H) and (J) highlight examples of large functional vessels. Arrows in (I) and (J) indicate perfused (functional) vessels. Note when a rare functional vessel in untreated KPC tumors is identified, it is extremely small relative to those in normal pancreata and PEGPH20 treated tumors. Scale bar, 10 μm for (H-J).
(K-M) Direct fluorescence analysis of Alexa-647-conjugated lectin (red) and doxorubicin (green) in intact normal pancreas (K), untreated KPC tumors (L), and KPC tumors 24 hours after PEGPH20 treatment (M). Arrow in (K) shows example of widely patent, thin-walled vessel and arrowheads indicate ductal epithelium. Large arrows in (L) and (M) highlight regions magnified in respective inset boxes. The left inset box in (L) shows signal in the far-red Alexa-647 channel (lectin) alone while the right inset box shows merged green (doxorubicin) and red (lectin) channels. Small arrows in inset box of panel (M) identify examples of specific nuclear staining from DNA-bound doxorubicin, as well as the presence of free doxorubicin in the tumor. Asterisks in (M) highlight examples of large, functional lectin-positive vessels loaded with doxorubicin. ac, acini; is, islet; d, duct. Scale bar, 50 μm for (K-M). See also Figure S2.

