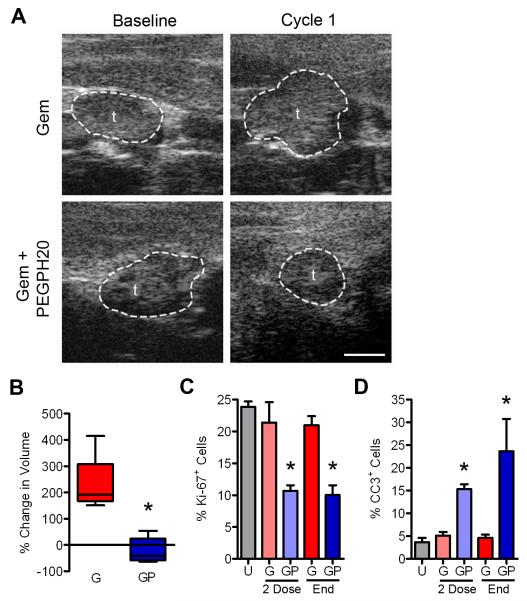
Figure 4. Gemcitabine+PEGPH20 induces objective responses through reduced proliferation and increased apoptosis.
(A) High-resolution ultrasound images of PDA before and after the indicated treatment. Scale bar, 1 mm. t, tumor.
(B) Quantitative analysis of tumor volume in Gem (G; n=5) and Gem+PEGPH20 (GP; n=6) treated mice after one cycle of therapy (*p=0.009). Box and whisker plots: boxes display the lower (25th) and upper (75th) quartiles with a line at the median; whiskers extend from the minimum to the maximum observation.
(C) Quantitative analysis of proliferation assessed as % of Ki-67+ cells per image field in untreated (U) and Gem (G) or Gem+PEGPH20 (GP) treated tumors after either two weekly doses of therapy (2 Dose; *p<0.035) or at endpoint (End; *p=0.0009).
(D) Quantitative analysis of apoptosis assessed as % cleaved caspase-3 (CC3)+ cells per image field in untreated (U) and Gem (G) or Gem+PEGPH20 (GP) treated tumors after two doses of therapy (*p=0.035) or at endpoint (*p=0.01). Data in (C and D) are plotted as mean ± SEM. See also Figure S4.

