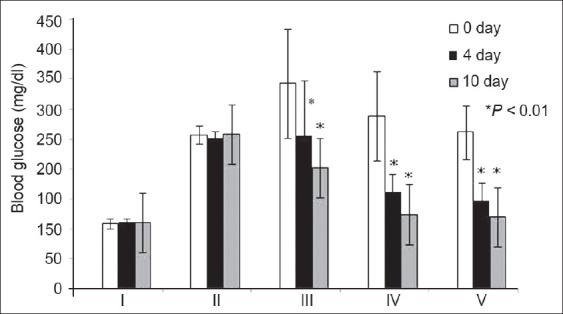
Figure 1.

Blood glucose levels in different groups on different days of treatment. Notations on x axis: I: Normal control; II: Diabetic control; III: Standard drug; IV: Strychnos nux-vomica ethanolic (50%) extract; V: Strychnos nux-vomica aqueous extract. Blood glucose values are presented as mean±SD; *represents significant percentage reduction of blood glucose level when compared with day 0 at P<0.01
