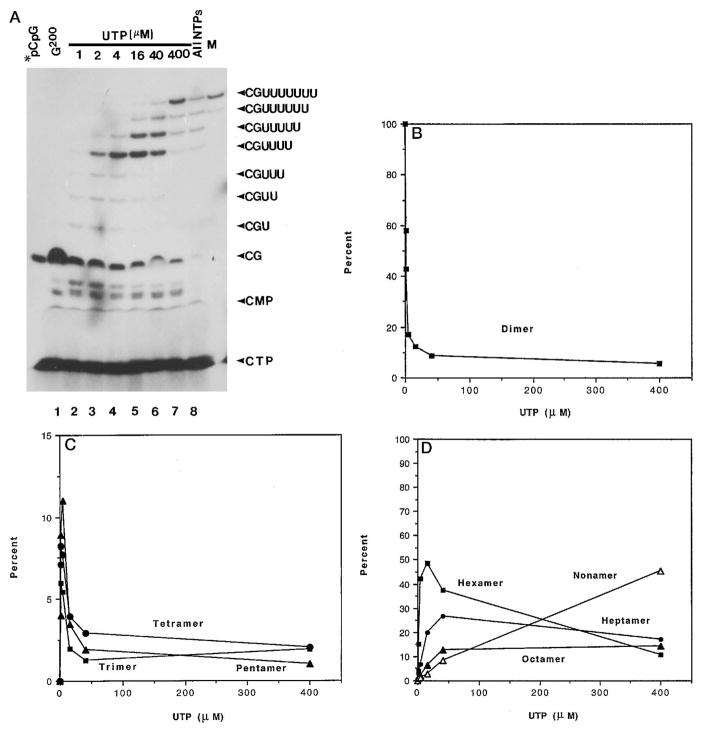
Fig. 5. Identification of cleavage products from a nested set of elongation complexes.
A, labeled G200 complexes were extended with 1 μM (lane 2), 2 μM (lane 3), 4 μM (lane 4), 16 μM (lane 5), 40 μM (lane 6), 400 μM (lane 7) UTP, or 400 μM each of all four nucleotides (lane 8) at 28 °C for 15 min. After washing, these complexes were treated with rat liver SII (phosphocellulose fraction, 0.5 μ g) and 7 mM MgCl2 for 10 min. Cleavage products were isolated and resolved on a 25% polyacrylamide gel. Shown in lane M is [32P]pCpGpUpUpUpUpUpUpU. Label comigrating with CTP and CMP is indicated. The amounts of dinucleotide (B); tri-, tetra-, and pentanucleotide (C); or hexa-, hepta-, octa-, and nonanucleotide (D) were quantitated as a percent of total oligonucleotides released in reactions such as those shown in A and plotted as a function of UTP concentration. Note the expanded y axis of panel C.

