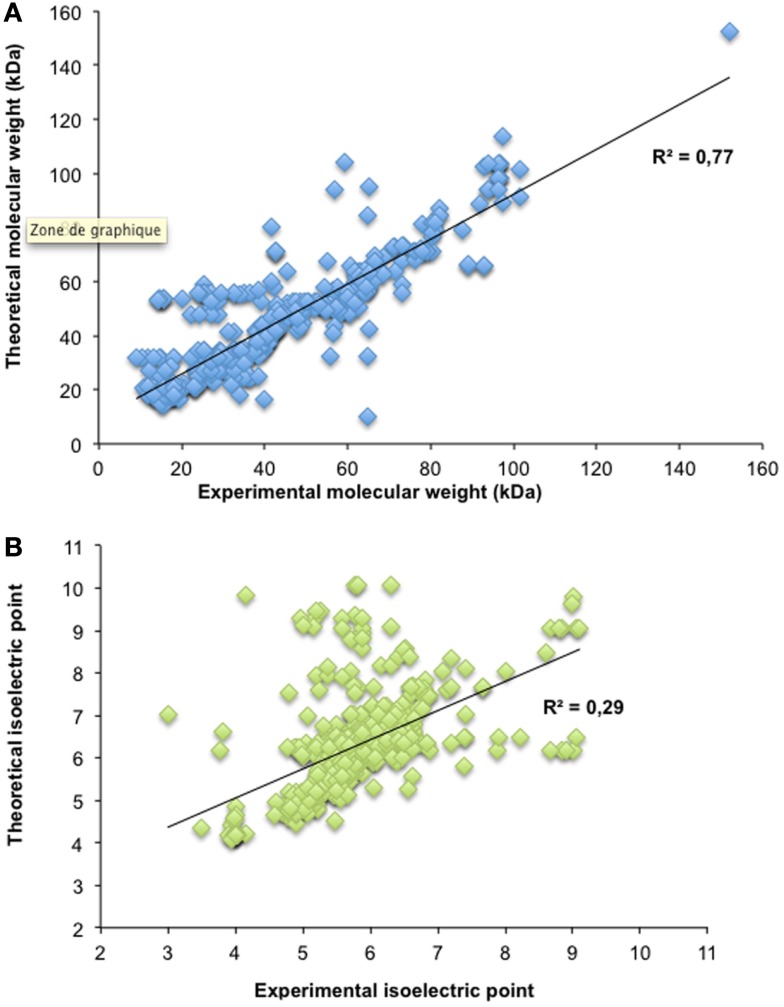
Figure 3.
Theoretical and observed molecular weight and isoelectric points. The theoretical and observed molecular weights (A) as well as the theoretical and observed isoelectric point (B) from 457 protein spots with a unique AGI-ID are plotted. For both linear regressions, the correlation coefficient is indicated on each graph.

