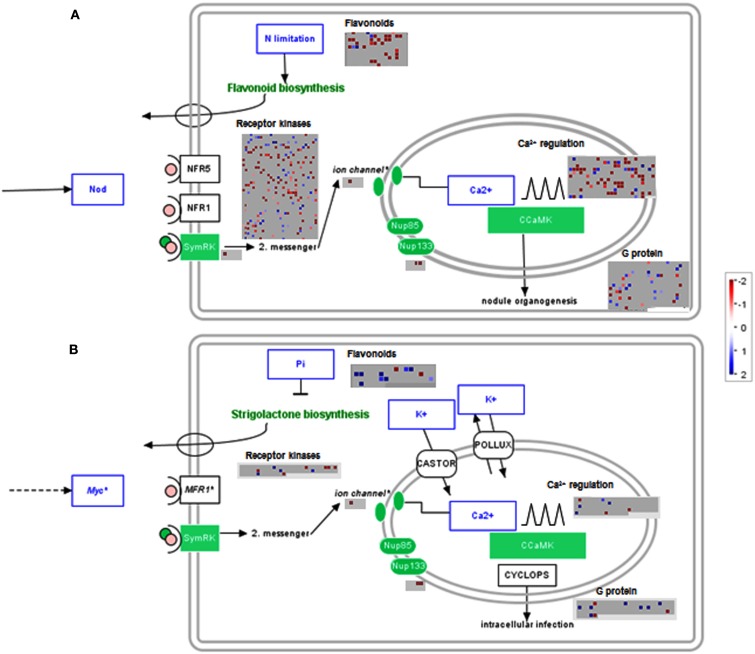
Figure 3.
Filtered gene responses (P < 0.05) of a MAPMAN overview of genes associated with symbiotic processes of lumichrome-treated (A) lotus and (B) tomato roots. The values are representative of the log2 transformed values of three individual hybridizations, statistically analyzed via robust multichip averaging (RMA) in R, and classed according to the MAPMAN classifications (Thimm et al., 2004; Usadel et al., 2005) adapted for lotus (Sanchez et al., 2008) and tomato (Urbanczyk-Wochniak et al., 2006), respectively. Red indicates a decrease whereas blue indicates an increase (see color scale).

