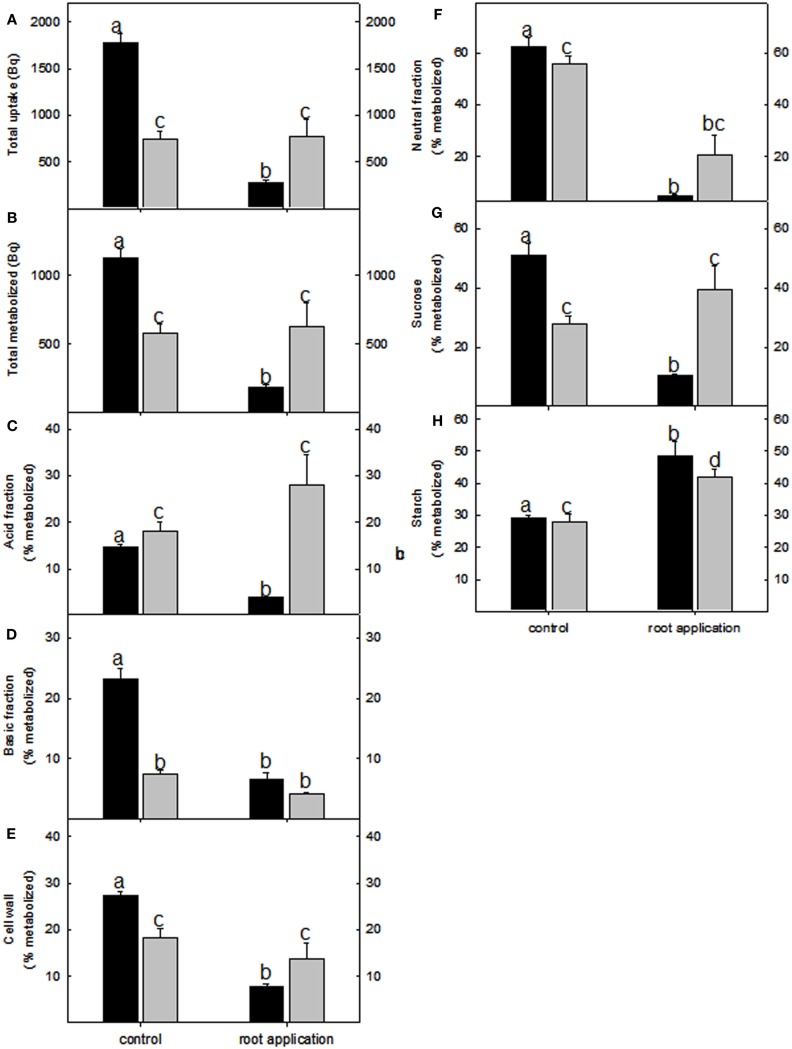
Figure 5.
Redistribution of radiolabel in lotus (black bar) and tomato (gray bar) root metabolic fractions following lumichrome treatment and incubation with 2 mM [U-14C] glucose. (A) Total label uptake, (B) total label metabolized and label distribution to (C) the acid fraction, (D) basic fraction, (E) cell wall fraction, as well as (F) neutral fraction was determined after a 3-h incubation period. Label distribution toward the (G) sucrose and (H) starch pools. The values are expressed as a percentage of the total radiolabel metabolized and are the mean ± SE (n = 6). The data was analyzed using one way ANOVA followed by Fisher’s least significant difference, bars that do not share letters are significantly different (P < 0.05) from each other.

