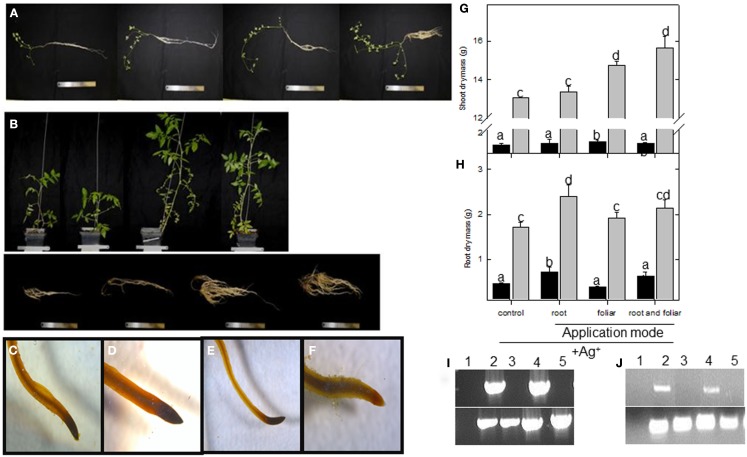
Figure A1.
Physiological assessment of lumichrome treatment on lotus and tomato plants. Phenotypes of control, 5 nM lumichrome root-drenched, foliar, and a combination of root and foliar applications (from left to right) of (A) lotus plants and (B) tomato shoots (top) and roots (bottom) grown under a 16-h photoperiod. Lugol staining of mature lateral root tips of (C) control and (D) lumichrome-treated lotus roots, and (E) control and (F) lumichrome-treated tomato roots. (G) Shoot and (H) root dry mass was recorded upon a weekly 10 μM AgNO3 treatment in parallel with untreated controls (see Figure 1) for lotus (black bar) and tomato (gray bar). Semi-quantitative RT PCR of EIN3 targets of (I) lotus and (J) tomato roots after silver ion inhibition for water control (1) untreated control (2), Ag+ untreated control (3), LC-treated (4), and Ag+ LC-treated (5) roots (from left to right). Bottom panel represents PP2A and 18S rRNA expression for lotus and tomato, respectively. The values are the mean ± SE (n = 6). The data was analyzed using one way ANOVA followed by Fisher’s least significant difference and bars that do not share letters are significantly different (P < 0.05) from each other.

