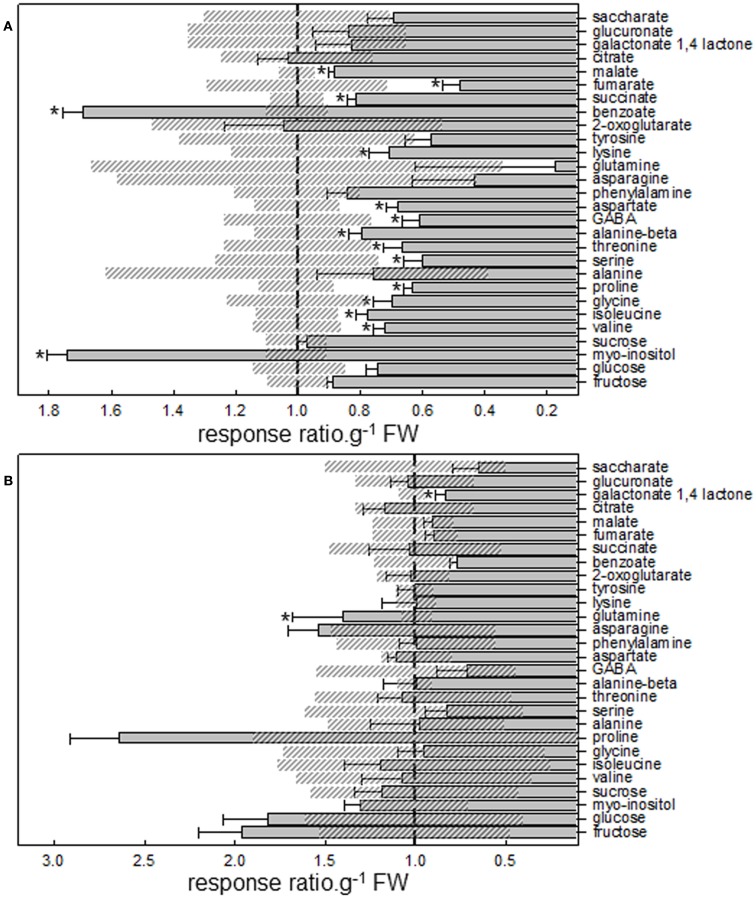
Figure A3.
Relative primary metabolite levels of (A) lotus and (B) tomato roots treated with 5 nM lumichrome. Data are normalized with respect to mean response calculated for the respective untreated control (to allow statistical assessment in the same way; indicated by vertical striped line). The values are the average ± SE (SE for control indicated with diagonal striped boxes) reported for five independent replicates and an asterisk indicates a value that was determined by Student’s t-test (P < 0.05) to be significantly different from the respective untreated control.

