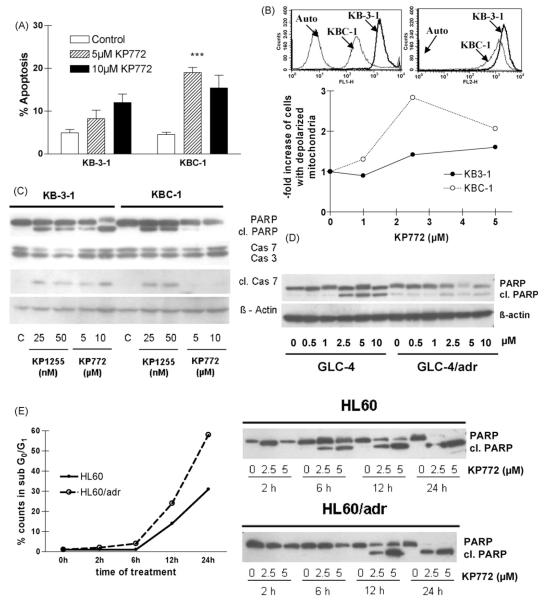
Fig. 3.
Induction of apoptosis in KB-3-1 and ABCB1-overexpressing KBC-1 cells after treatment with KP772 for 24 h. (A) Percentages of apoptotic nuclei in untreated controls and cells treated with 5 and 10 μM KP772 were determined microscopically after DAPI staining. Three hundred to 500 nuclei of at least two cytospin slides for each concentration and cell line were counted. (B) Accumulation of green-fluorescent cytoplasmic (FL-1, left) and red-fluorescent mitochondrial (FL-2, right) JC-1 in the indicated cell lines is shown in the upper panel. The lower panel indicates loss of mitochondrial membrane potential after treatment with KP772. The proportions of apoptotic KB-3-1 and KBC-1 cells after treatment with the indicated drug concentrations are shown normalised to the untreated control. (C) Caspase-induced cleavage of PARP, caspase 7 and caspase 3 in KB-3-1 and KBC-1 cells after treatment with KP772 at the indicated concentrations was determined via Western blotting. The bismuth compound KP1255 was used as positive control. Antibodies used are described under Section 2. (D) Caspase-induced cleavage of PARP in GLC-4 and ABCC1- and LRP-overexpressing GLC-4/adr cells after treatment with KP772 at the indicated concentrations was determined via Western blotting. (E) After treatment with KP772 for the indicated time periods, HL60 and ABCC1-overexpressing HL60/adr cells were analysed for apoptosis induction by both Western blotting and FACS. Immunoblots (right panel) show the time-dependent cleavage of PARP by treatment with 2.5 and 5 μM KP772. For FACS analysis cells treated with 2.5 μM KP772 were fixed and stained with ethanol and PI, respectively. Percentages of the apoptotic subG0/G1 compartment were calculated by Cell Quest Software.

