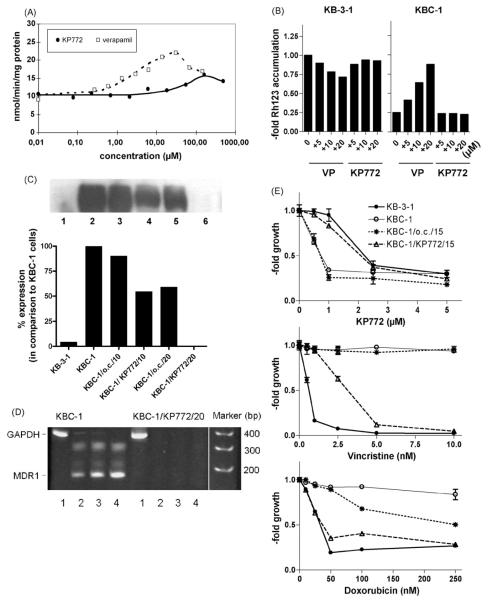
Fig. 5.
Impacts of KP772 on ABCB1 expression and function. (A) The impact on ABCB1 ATPase activity was determined by analysing the rate of ATP hydrolysis in ABCB1-containing plasma membrane vesicles [9] at increasing concentrations of KP772 (straight line) or VP (dashed line). The concentration–response curves were fitted to the data points by non-linear regression analysis. (B) Rh123 accumulation in KB-3-1 and KBC-1 cells with and without coadministration of KP772 and VP at the indicated concentrations was measured after 1 h drug exposure by FACS analysis. Data were normalised to Rh123 accumulation of untreated KB-3-1 cells. One of three experiments delivering comparable results is shown. (C) ABCB1 expression levels of KB-3-1 (lane 1), KBC-1 (lane 2), and KBC-1 cells cultured without colchicine selection for 10 passages (KBC-1/o.c./10; lane 3), and 20 passages (KBC-1/o.c./20; lane 5) or under exposure to 0.7 μM KP772 for the identical time periods (KBC-1/KP772/10; lane 4 and KBC-1/KP772/20; lane 6, respectively) were measured in membrane-enriched fractions by Western blot and quantified by Molecular Analyst software (Biorad). (D) ABCB1 mRNA expression in KBC-1 and KBC-1/772/20 cells was analysed by RT-PCR. Amplification products obtained using GAPDH-specific (358 bp product; 25 cycles, lane 1) and ABCB1-specific (167 bp product; 25, 30, 35 PCR cycles, lanes 2–4) oligonucleotide primers, respectively, were separated by acrylamide gel electrophoresis and stained by ethidium bromide. (E) Concentration–response curves were established for the indicated drugs in KB-3-1, KBC-1, KBC-1/o.c./15 and KBC-1/KP772/15 cells. Following 72 h drug exposure, cell viability was determined by MTT assays.

