
Figure 2.
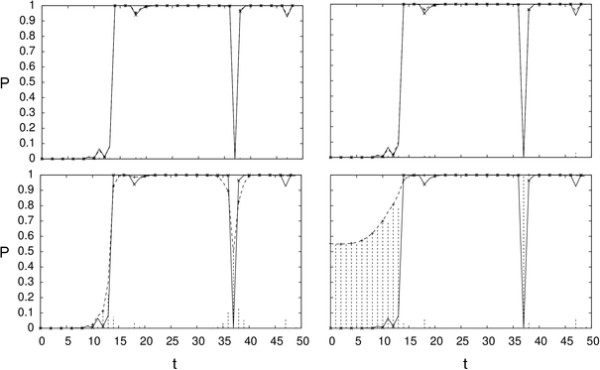
Simulated data: approximate posterior. We show the posterior probability of state 1 (y-axis) for first fifty observations (x-axis) with w = 0.5σD (top left), 1.0σD (top right), 1.5σD (bottom left), and 2.0σD (bottom right). The true posterior is shown as a solid line, the approximate posterior as a dashed line, and their absolute difference is shown in dashed vertical lines.