
Figure 8.
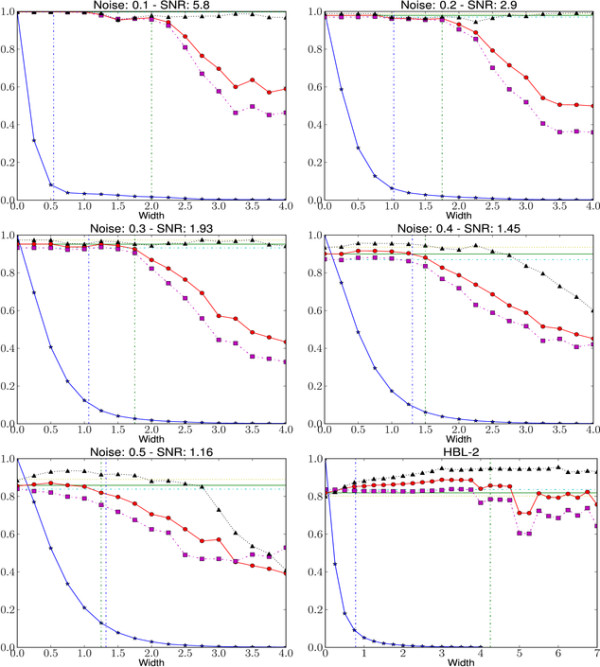
Effect of width parameter. F1-measure (red, circle), recall (violet, square), and precision (black, triangle) of approximate sampling over HBL-2 and five synthetic datasets of varying noise levels are shown. For comparison, F1-measure (green, solid), recall (cyan, dashed dot), and precision (olive, dotted) of FBG-sampling are also shown as horizontal lines. For width values 0.0σD, ..., 4.0σD compression ratio is shown as blue line with stars. Knee is predicted using L-method and shown as a vertical line (blue, dashed dot). Vertical line (green, dashed dot) showing best width is selected by visual inspection.