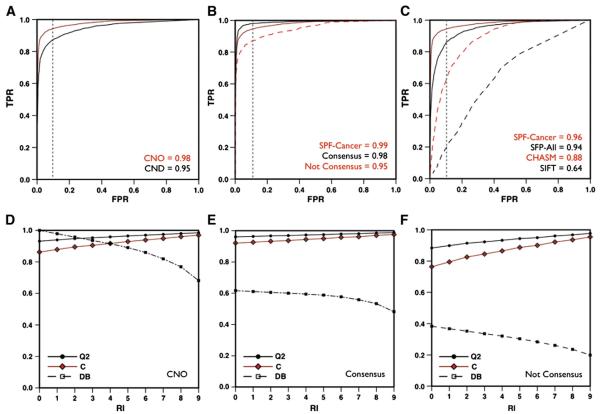
Fig. 1.
Performance of SPF-Cancer method. ROC curve of SPF-Cancer method on CNO and CND (panel A) on CNO dataset and Consensus and Not Consensus subsets (panel B).In panels C, ROC curves of SIFT, CHASM, SPF-All and SPF-Cancer on the Synthetic dataset. Plot of the accuracy (Q2), correlation coefficient (C) and percentage of the dataset (DB) as a function of the reliability index (RI) for SPF-Cancer method on CNO dataset (panel D) and Consensus (panel E) and Not Consensus subsets (panel F).

