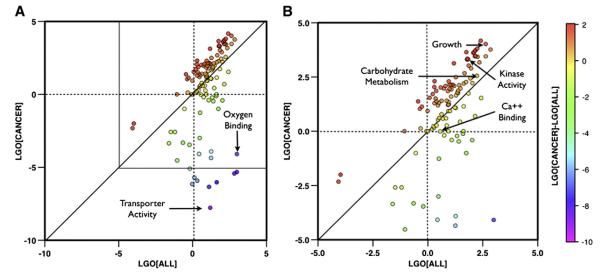
Fig. 3.
General and cancer-specific LGO scores. Scatter plot of the generic vs the cancer-specific LGO scores (LGO[All] and LGO[Cancer]) for each GO slim term (panel A). Color scale is related to the value of LGO[Cancer]-LGO[ALL]. In panel B, zoom of the plot in the region of LGO scores between −5 and 5.

