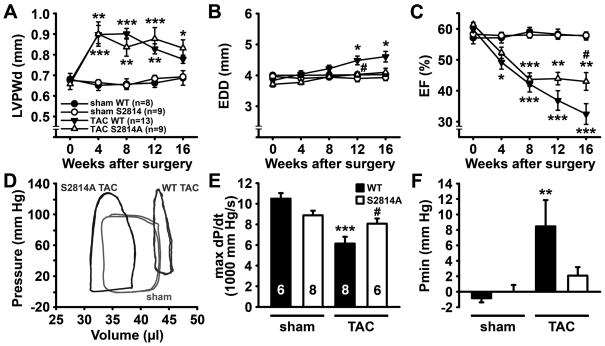
Figure 2. S2814A mice exhibit delayed progression of heart failure following TAC.
A–C. Echocardiographic analysis of left ventricular posterior wall diameter (LVPWd) (A), end-diastolic diameter (B), and ejection fraction (EF) (C) in S2814A mice or WT littermates before, 4, 8, 12, and 16 weeks after sham or transverse aortic constriction (TAC), respectively. D. Representative pressure-volume loops at 16 weeks post-TAC showing reduced LV diastolic volume and improved contractility in a S2814A mouse compared to WT. Representative loops indicate one animal per group. Numbers in panel A indicate number of animals used in panels A–D. E. Bar graph showing significant decrease in cardiac contractility (dP/dt) in WT mice following TAC, which was blunted in S2814A mice. Numbers in bar indicate number of animals used in panels E–F. F. Unlike WT mice, S2814A mice did not develop elevated end-diastolic LV pressure at 16 weeks post-TAC. *P<0.05, ** P<0.01, *** P<0.001 versus corresponding sham group, #P<0.05 versus WT TAC.

