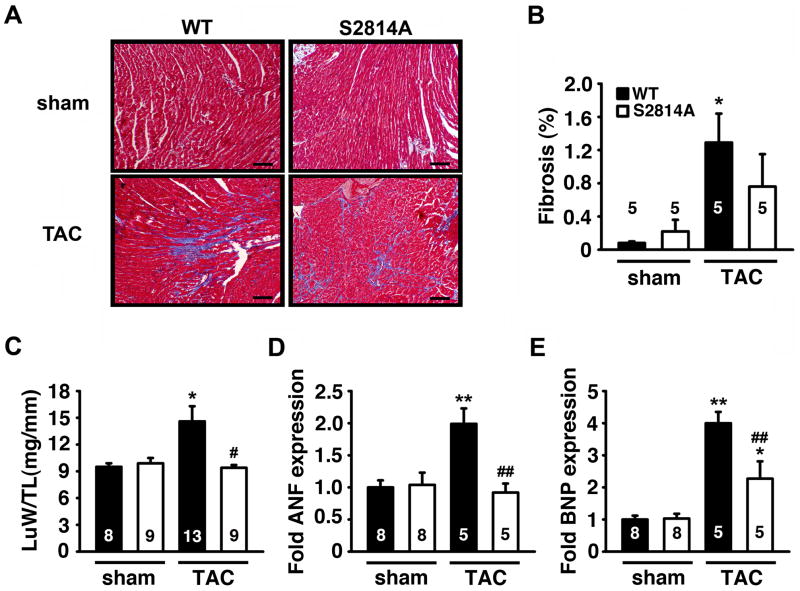
Figure 4. Reduced cardiac remodeling associated with heart failure following TAC in S2814A mice.
A. Representative photographs of sections at the midsaggital level of hearts stained with Masson’s Trichrome (scale bar = 1 mm). B. Quantification of cardiac fibrosis at 16 weeks after sham or TAC surgery. C. Post-mortem measurements of lung weight to tibia length (LuW/TL) ratios 16 weeks after TAC. D, E. mRNA transcript levels of cardiac stress genes ANF (D) and BNP (E) by real-time PCR. Numbers in bar indicate number of animals. * P<0.05, ** P<0.01 versus corresponding sham group; # P<0.05, ## P<0.01 versus WT TAC.

