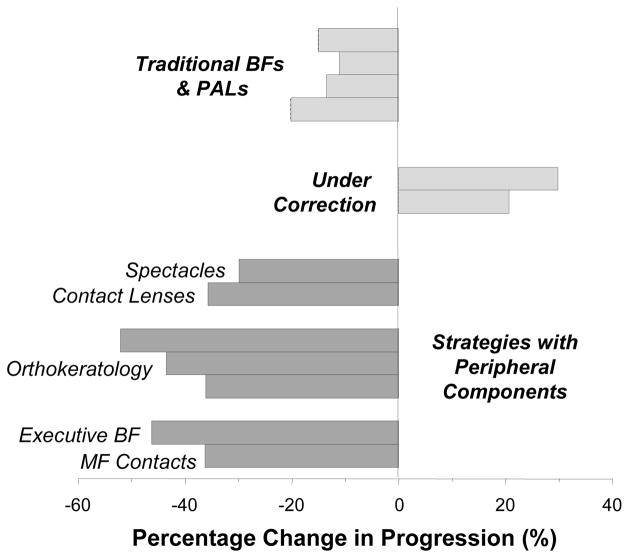
Figure 10.
Relative efficacy of optical treatment strategies for slowing myopia progression. For most of the studies, refractive-error data were used to calculate the percentage difference in progression rate between the treated and control groups. For the orthokeratology trials measures of vitreous chamber depth or axial length were employed to calculate the differences in axial elongation rate between the treated and control groups. The data for traditional bifocals and progressive addition lenses were obtained from references 27, 29, 30, 104. The results for under-correction strategies were obtained from references 25, 26. The results for strategies which included significant peripheral components were obtained from 107 for spectacle lenses, 108 for contact lenses, 112–114 for orthokeratology, 28 for executive bifocals, and 115 for multi-focal contact lenses.

