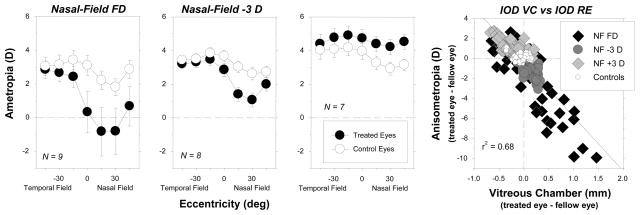
Figure 4.
Average (±SE) spherical-equivalent refractive corrections obtained at the end of the lens-rearing period (about 4.5 months of age) plotted as a function of horizontal visual field eccentricity for monkeys reared with spectacle lenses that produced either form deprivation (leftmost),88 3 D of hyperopic defocus (second from left),89 or 3 D of myopic defocus in the nasal fields of the treated eyes (second from right). The treated and control eyes are represented by the filled and open symbols, respectively. In the right plot, the interocular differences in refractive error are plotted as a function of the interocular differences in vitreous chamber depth. Individual data are shown for the different visual field eccentricities. The solid line represents the best fitting regression line. NF FD = nasal field form deprivation; NF −3 D = nasal field hyperopic defocus; NF +3 D = nasal field myopic defocus; controls = normal monkeys.

