
Table 1.
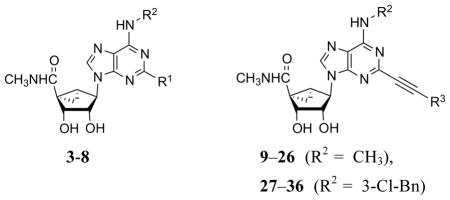
Binding affinity of a series of (N)-methanocarba adenosine derivatives at three subtypes of hARs and the functional efficacy at the hA3AR.
 | ||||||
|---|---|---|---|---|---|---|
| Compd | Structure | Affinity (Ki, nM) or % inhibitiona | %Efficacyb | |||
| R1 or R3 | R2 | hA1 | hA2A | hA3 | hA3 | |
| 3c | Cl | 3-Cl-Bn | 260±60 | 2300±100 | 0.29±0.04 | 103±7 |
| 4c,d | Cl | 3-I-Bn | 136±22 | 784±97 | 1.5±0.2 | 100 |
| 5c | H | 3-I-Bn | 700±270 | 6200±100 | 2.4±0.5 | 100 |
| 6d | C≡CH | 3-Cl-Bn | 174±23 | (48%) | 1.30±0.38 | ND |
| 7d | C≡C(CH2)2CH3 | 3-Cl-Bn | 1040±83 | (80%) | 0.82±0.20 | ND |
| 8c,d | Cl | CH3 | 2100±1700 | (6%) | 2.2±0.6 | ND |
| 9 |  |
CH3 | (13%±6%) | (14%±7%) | 0.85±0.22 | 89.3±7.7 |
| 10 |  |
CH3 | (11%±4%) | (13%±4%) | 1.01±0.36 | 86.8±9.2 |
| 11 |  |
CH3 | (21%±4%) | (17%±2%) | 0.97±0.38 | 97.7±9.1 |
| 12 |  |
CH3 | (12%±2%) | (10%±5%) | 0.97±0.24 | 95.8±6.7 |
| 13 |  |
CH3 | (21%±11%) | (19%±3%) | 0.53±0.09 | 80.3±5.8 |
| 14 |  |
CH3 | (27%±7%) | (30%±5%) | 0.58±0.04 | 84.2±6.2 |
| 15 |  |
CH3 | (10%±2%) | 1270±300 | 1.60±0.60 | 90.9±1.9 |
| 16 |  |
CH3 | (14%±1%) | (30%±1%) | 1.22±0.31 | 97.4±9.1 |
| 17 |  |
CH3 | (13%±7%) | (26%±1%) | 0.91±0.06 | 97.5±12.3 |
| 18 |  |
CH3 | (10%±5%) | (19%±14%) | 1.07±0.14 | 109±4.1 |
| 19 | 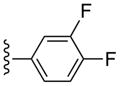 |
CH3 | (6%±3%) | (6%±6%) | 1.65±0.08 | 108±1.9 |
| 20 | 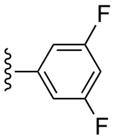 |
CH3 | (8%±3%) | (47%±4%) | 1.66±0.36 | 99.6±3.3 |
| 21 | CH3 | (13%±3%) | (38%±5%) | 3.78±1.16 | 110±4.9 | |
| 22 | CH3 | (23%±5%) | (7%±5%) | 10.1±1.9 | 78.4±6.5 | |
| 23 | CH3 | (15%±7%) | 5300±600 | 2.57±0.78 | 87.4±9.9 | |
| 24 | 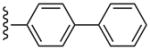 |
CH3 | (21%±6%) | (29%±8%) | 3.10±1.26 | 110±2.9 |
| 25 |  |
CH3 | (25%±1%) | (34%±8%) | 1.67±0.18 | 94.6±4.4 |
| 26 | 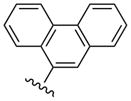 |
CH3 | (15%±5%) | (52%±1%) | 3.48±1.36 | 108±3.5 |
| 27 |  |
3-Cl-Bn | (20%±3%) | (27%±3%) | 1.34±0.30 | 101±5.9 |
| 28 | 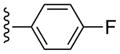 |
3-Cl-Bn | (20%±6%) | (42%±2%) | 2.16±0.34 | 102±1.4 |
| 29 | 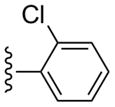 |
3-Cl-Bn | (19%±2%) | (52%±12%) | 1.92±0.57 | 103±1.5 |
| 30 | 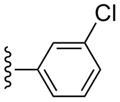 |
3-Cl-Bn | (4%±4%) | 1740±590 | 4.45±1.39 | 91.5±11.4 |
| 31 |  |
3-Cl-Bn | (6%±4%) | (41%±10%) | 3.49±1.84 | 95.7±6.4 |
| 32 | 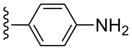 |
3-Cl-Bn | 1520±300 | (44%±4%) | 2.27±0.70 | 76.6±13.1 |
| 33 |  |
3-Cl-Bn | (6%±5%) | (38%±5%) | 6.75±2.78 | 86.7±5.4 |
| 34 |  |
3-Cl-Bn | (2%±2%) | (0%±0%) | 3.06±1.35 | 89.0±4.5 |
| 35 |  |
3-Cl-Bn | (8%±2%) | 3110±530 | 68.3±12.5 | 77.8±11.6 |
| 36 |  |
3-Cl-Bn | (11±5%) | (4±3%) | 660±170 | 97.1±3.3 |
All experiments were done on CHO or HEK293 (A2A only) cells stably expressing one of three subtypes of the four hARs. The binding affinity for A1, A2A and A3ARs was expressed as Ki values (n = 3–5) and was determined by using agonist radioligands ([3H]N6-R-phenylisopropyladenosine 52 (R-PIA), [3H]2-[p-(2-carboxyethyl)phenyl-ethylamino]-5′-N-ethylcarboxamidoadenosine 53 (CGS21680), or [125I]N6-(4-amino-3-iodobenzyl)adenosine-5′-N-methyl-uronamide 54 (I-AB-MECA), respectively), unless noted.29–31 A percent in parentheses refers to inhibition of radioligand binding at 10 μM (n = 3).
Unless noted, the efficacy at the hA3AR was determined by inhibition of forskolin-stimulated cAMP production in AR-transfected CHO cells.32–34 At a concentration of 10 μM, in comparison to the maximal effect of 5′-N-ethylcarboxamidoadenosine 48 (=100%) at 10 μM. Data are expressed as mean±standard error (n = 3).
Values from Melman et al.21
ND, not determined.