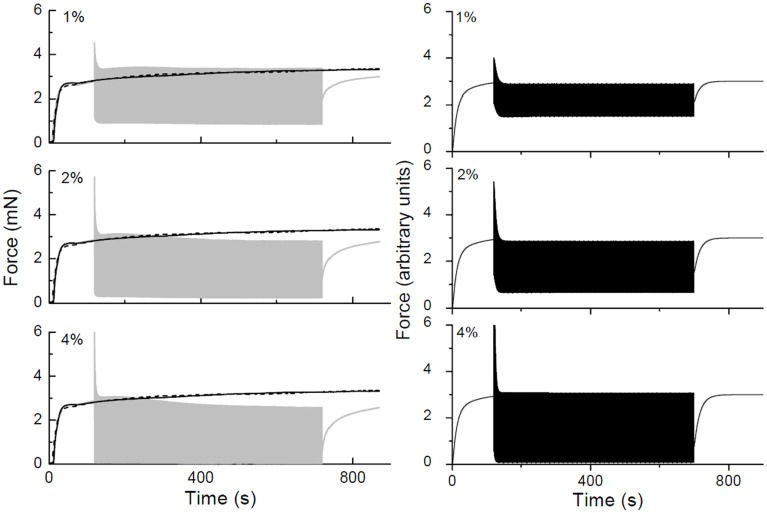
Figure 10.
Force-time traces obtained in a strip of rat trachealis muscle. The gray curves show data obtained with 2 Hz length oscillations having amplitudes of ±1, ±2, and ±4% baseline length as indicated. Isometric force-time curves are shown in black (solid lines obtained prior to collecting oscillation data, dashed lines obtained afterward). The black curves in the right-hand panels show corresponding force-time plots simulated by a lumped-parameter model of the ASM strip that includes an empirical mechanism accounting for cross-bridge attachment and detachment kinetics.

