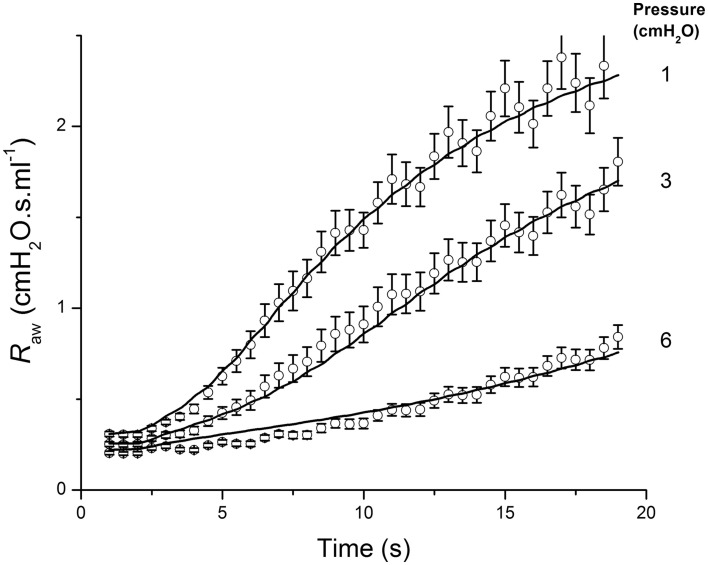
Figure 11.
Airway resistance measured in mice (open circles: mean ± SEM) following an intravenous injection of methacholine at time 0, when the lung inflation pressure was set to the three different values indicated at the right of the figure. The solid line shows the fit provided by a computational model of an elastic airway embedded in parenchyma that contracts according to a hyperbolic force-velocity relationship. Adapted from Cojocaru et al. (2008).

