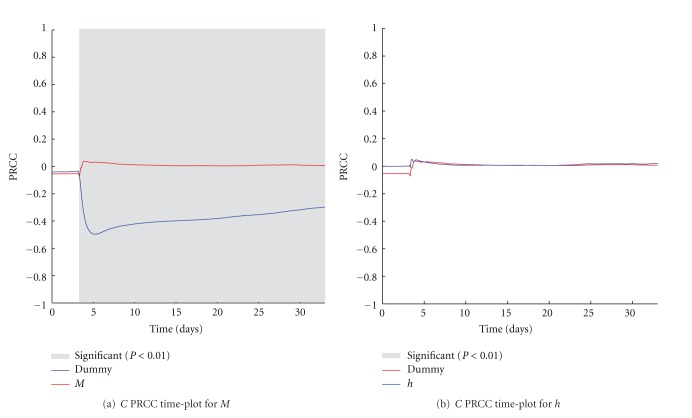
Figure 5.
M (a) and h (b) PRCC plots computed on C. PRCC values are calculated with respect to the number of melanoma cells (C), plotted over time (blue lines). PRCC time plot of Dummy parameter (red lines) is shown for comparison. Greyed areas represent the plot portions where correlation is significant (P < 0.01).

