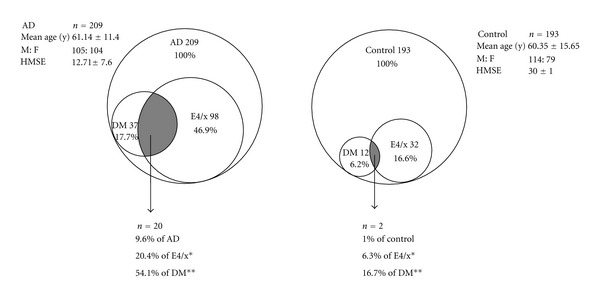
Figure 1.

Venn diagram representation of AD and controls with their component distribution. Odds ratio comparing DM occurrence in ApoE4 carriers between AD and controls is 3.85 (P = 0.1*). Odds ratio comparing ApoE4-positive DM subjects between AD and controls is 5.68 (P = 0.04**).
