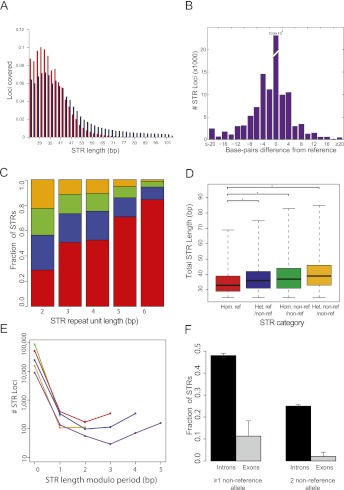
Figure 5.
Genome-wide STR profile of an individual. (A) Distribution of STRs with 20× coverage or more as a function of the allele size in hg18. (B) Distribution of allele size differences from reference in lobSTR calls. The average difference was 6.3 bp away from the reference. (C) STR polymorphism as a function of period. The number of STR alleles matching the reference sequence increases with increasing repeat unit length. (Red) Homozygous reference; (blue) heterozygous nonreference/reference; (green) homozygous nonreference/nonreference; (orange) heterozygous nonreference/nonreference. (D) Longer STR regions are more polymorphic. The median STR length (thick black line) increases with the number of variant alleles. (*) A significant (p < 0.05) difference according to a one-sided Mann–Whitney test. Boxes denote the interquartile range, and whiskers denote three times the interquartile range. (E) lobSTR shows mutational trends at single-base-pair resolution. The number of base pairs different from the reference modulo period size versus the number of alleles detected (in logarithmic scale) is shown for each period; (green) period 2; (orange) period 3; (red) period 4; (blue) period 5; (purple) period 6. Incomplete STR unit differences tend to differ by a full unit ±1 bp from the reference. (F) Fraction of trinucleotide STRs with nonreference alleles in introns versus exons. The 95% confidence intervals are given by the error bars.

