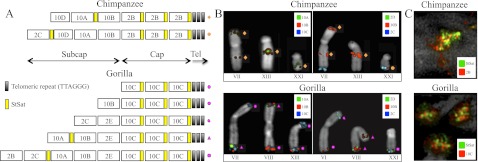
Figure 3.
Schematic representation of the organization of subtelomeric regions. (A) Cap and subcap regions have been reported according to FISH experiments and copy number count in chimpanzee (top lines) and gorilla (bottom lines). (B) Extracted chromosomes representing examples of all the different organizations observed in the subterminal regions of chimpanzee and gorilla. (C) FISH on stretched chromosomes showing the interdigitation between StSat and regions 2B and 10C in chimpanzee and gorilla, respectively.

