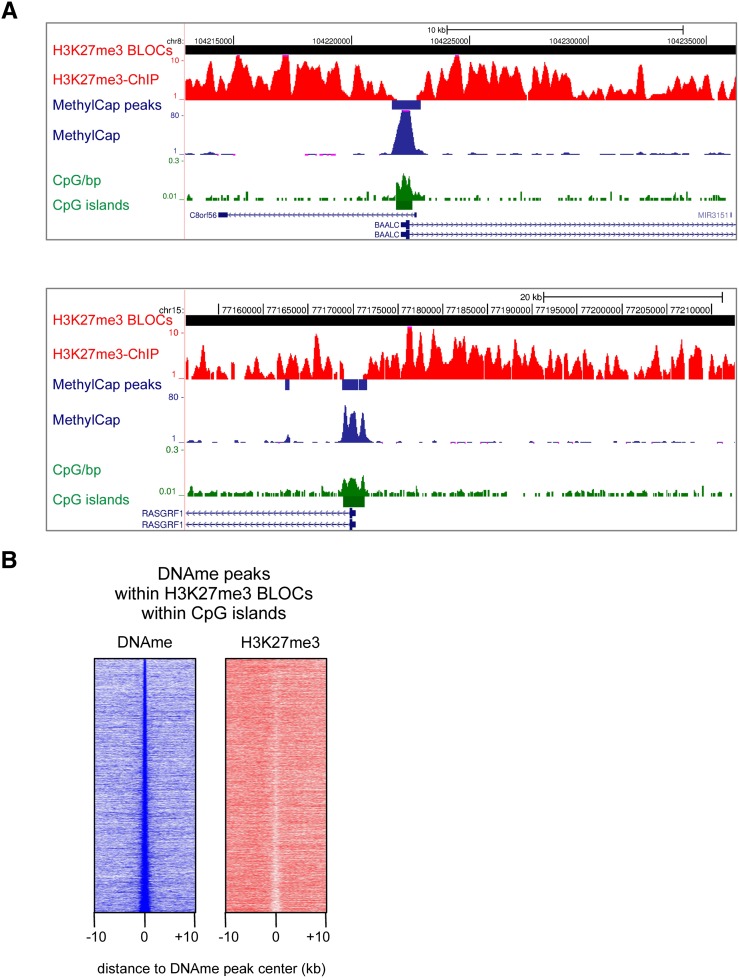
Figure 3.
H3K27me3 is locally depleted at hypermethylated CpG islands. (A) Examples of the genome-wide H3K27me3 ChIP-seq and MethylCap-seq data, demonstrating hypermethylated CpG islands within H3K27me3 BLOCs, and concomitant local depletion of H3K27me3. H3K27me3-enriched BLOCs and MethylCap peaks are indicated as red and blue rectangles, respectively. (B) Density maps of MethylCap-seq and H3K27me3 ChIP-seq read densities in 20-kb regions surrounding MethylCap peaks that reside in H3K27me3 BLOCs and overlap with CpG islands.

