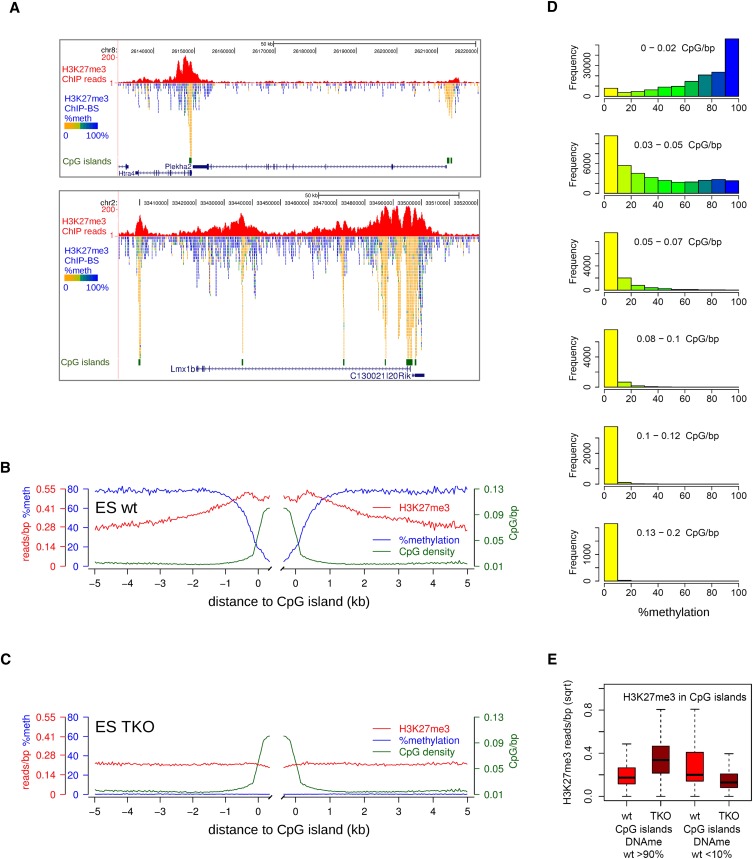
Figure 4.
Localized peaks of H3K27me3 in wild-type mES cells over CpG islands. (A) Screenshots of localized H3K27me3 peaks (red). Per covered CpG, percentage methylation as derived from the H3K27me3-BS-seq data is indicated in color. (B,C) Average profiles of DNA methylation (blue), H3K27me3 (red), and CpG density (green) in H3K27me3 peaks over CpG islands, as determined from H3K27me3-ChIP-BS-seq. (D) Histograms showing the distribution of methylation in 300-bp windows through H3K27me3 peaks, as inferred from H3K27me3 ChIP-BS-seq. Windows were categorized according to CpG density. (E) H3K27me3 changes in CpG islands that were either hypermethylated (>90%, left) or hypomethylated (<10%, right) in wild-type mES cells. Read counts shown are from conventional H3K27me3 ChIP.

