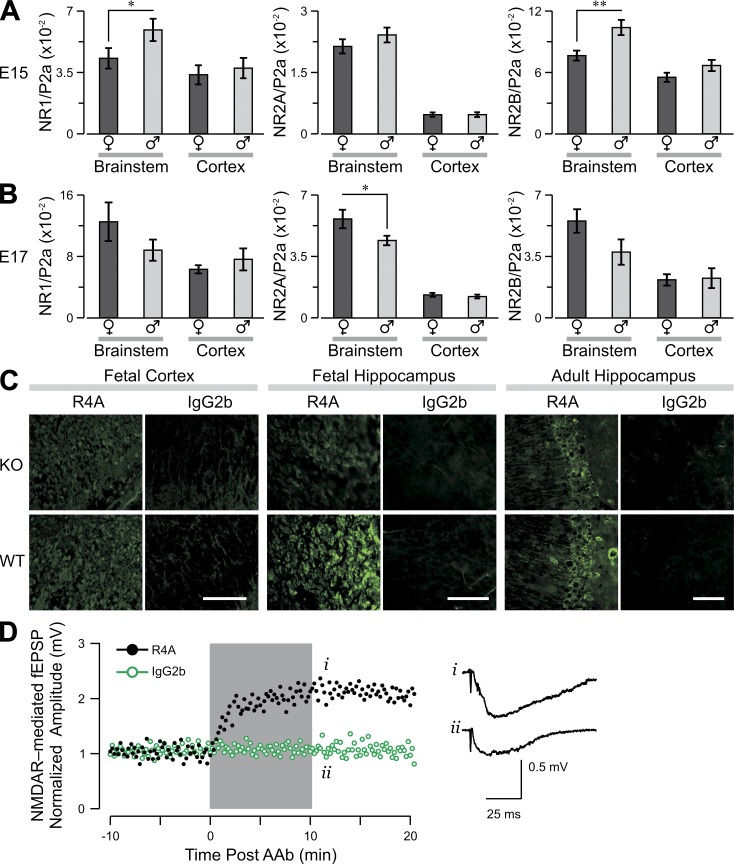
Figure 3.
Expression of messenger RNA for NMDAR subunits NR1, NR2A, and NR2B in fetal brain. Graphs show the level of messenger RNA transcript (mean ± SEM) for each subunit, divided by the level of polymerase 2a (P2a). (A and B) Male and female fetuses of WT mice were harvested at E15 (A) or E17 (B), and qPCR was used to assess transcripts of NR1 (left), NR2A (middle), and NR2B (right) in brainstem and cortex. Sample size, 12–15 fetuses per column. *, P < 0.05; **, P < 0.01, Student’s t test. Data show a representative experiment from three independent experiments. (C, left and middle) R4A or control IgG2b staining of WT or NR2A−/− fetal brain. (right) R4A or control IgG2b staining of WT or NR2A−/− adult hippocampus. Bars: (left and middle) 50 µm; (right) 100 µm. (D) R4A triggers an enhancement in the amplitude of excitatory postsynaptic potentials (EPSP), mediated by NMDARs, in NR2A−/− hippocampus. The gray box marks the period of antibody application. (right) Representative traces obtained immediately after treatment with R4A (i) or IgG2b control (ii). Representative data from three independent experiments are shown.

