Figure 1.
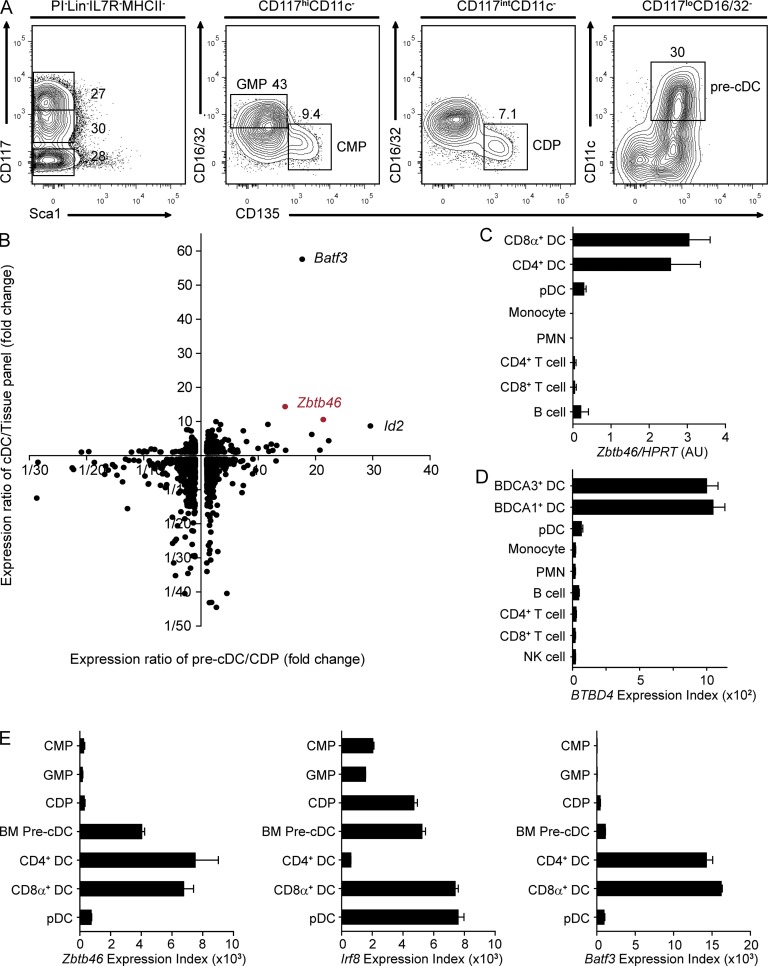
Zbtb46 is expressed in BM pre-cDCs and cDCs in both mouse and human. (A) BM cells from WT mice were stained for expression of the indicated markers. Two-color histograms are shown for live cells pregated as indicated above the diagram. Numbers represent the percentage of cells within the indicated gate. Data are representative of five independent experiments with at least two mice each. (B) Sorted populations in A were analyzed by gene expression microarray as described in Materials and methods. Gene expression levels were determined for a list of all transcription factors using dChip software (Li and Wong, 2001a,b) for the splenic pre-cDC, BM CDP, CD8α+ and CD4+ cDCs, and a broad panel of tissues (Lattin et al., 2008). For each transcription factor, the horizontal axis indicates the ratio of gene expression in the pre-cDC compared with the CDP, and the vertical axis indicates the ratio of the mean expression in CD8α+ and CD4+ DCs compared with the mean expression in the tissue panel excluding DCs. Each dot indicates an individual probe set. (C) Shown is the normalized expression value of Zbtb46 mRNA determined by quantitative RT-PCR for the indicated cell populations. Data represent three independently sorted replicates from three mice. (D) Shown is the expression value of BTBD4 mRNA in the indicated cells derived from Lindstedt et al. (2005) and Du et al. (2006). (E) Shown are the expression values for mouse Zbtb46, Irf8, and Batf3 mRNA transcripts in the indicated cell populations determined by expression microarray. Microarray analysis in B and E represents either two or three independently obtained arrays from progenitors sorted from three to five pooled WT mice. cDC arrays in E are derived from Robbins et al. (2008). (C–E) Bars represent the mean ± SEM.

