Figure 8.
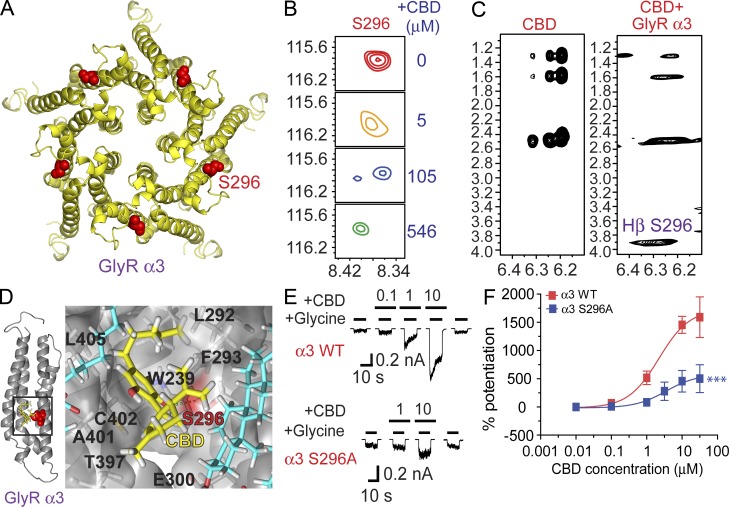
NMR analysis: a direct interaction between CBD and S296-containing domain of α3 GlyR. (A) A homology model of α3 GlyR-TM domain structure derived from the high-resolution NMR structure of α1 GlyR TM domains. S296 residue is highlighted in red. (B) Contour plots of the S296 resonance in the HSQC spectrum of the α3 GlyR TM domains in LPPG micelles as a function of CBD concentrations: red, 0 µM; orange, 5 µM; blue, 105 µM; and green, 546 µM. (C) Strip plots of the 2D 1H-1H NOESY spectra in the absence and presence of α3 GlyR TM domains, showing an unambiguous cross peak between the aromatic protons of CBD and the Hβ of S296. (D) Side views of a proposed binding interaction between CBD and the α3 GlyR-TM involving the S296, as revealed by a molecular dynamic simulation of 20 ns. The S296 residue is indicated in red and CBD is indicated in yellow. Lipids surrounding the S296-containing domain are indicated in blue. (E) Traces of CBD-induced potentiation on IGly in HEK 293 cells expressing the WT (n = 5) and mutant S296A (n = 6) α3 GlyRs. (F) The concentration-response curves of CBD-induced potentiation of the α3 GlyRs. ***, P < 0.001 (WT vs. S296A). Data are representative of two independent experiments and expressed as mean ± SEM.

