Figure 9.
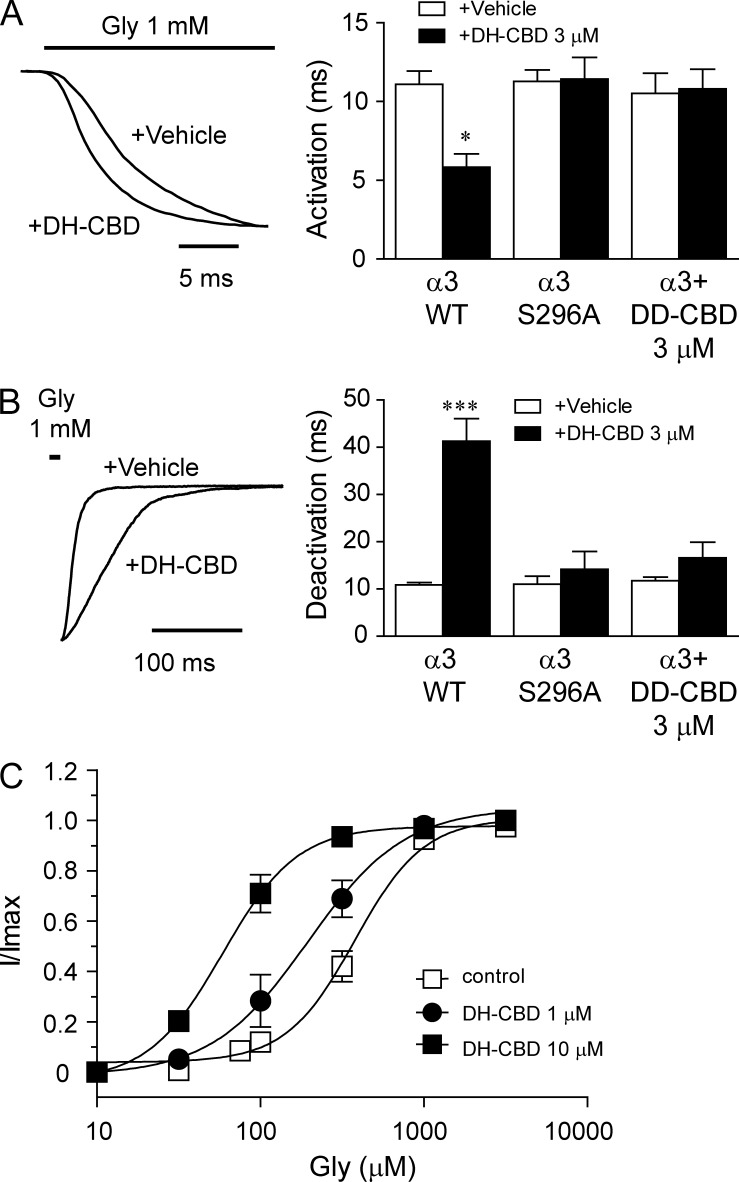
The effect of DH-CBD on α3 GlyR gating kinetics and agonist affinity. (A) Traces of currents activated by 1 mM glycine in HEK 293 cells expressing WT or S296A mutant α3 GlyRs in the absence and presence of 3 µM DH-CBD. Bar graph shows the mean activation time constant (n = 6–9). Asterisks indicate a significant difference as compared with vehicle (*, P < 0.05). (B) Traces of currents during a washout after a 10-ms application of 1 mM glycine in the absence and presence of 3 µM DH-CBD. The bar graph shows mean deactivation time constants (n = 6–7). The asterisk indicates a significant difference as compared with vehicle (***, P < 0.001). (C) The glycine concentration-response curves in the absence (n = 6) and presence of 1 µM (n = 8) and 10 µM (n = 5) DH-CBD. Data are representative of two independent experiments and expressed as mean ± SEM.

