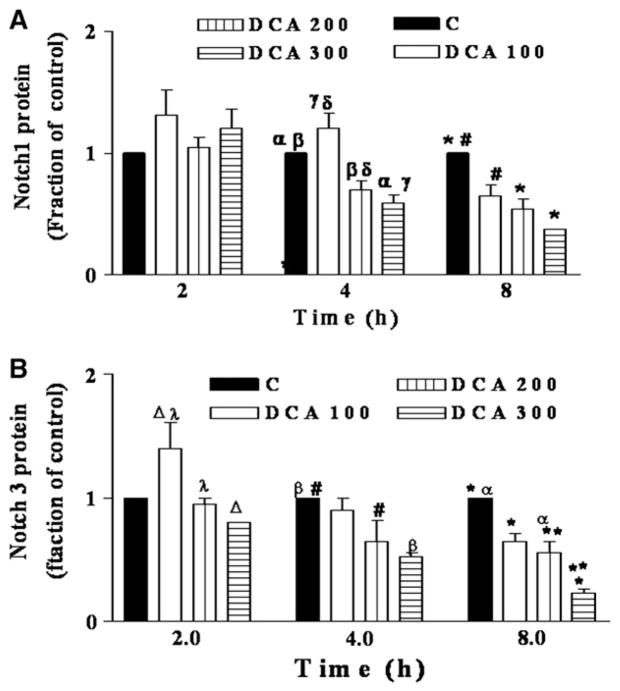
Fig 2.
In OE33 cells, Notch1 and Notch3 protein levels are decreased by DCA in a concentration and time dependent manner. OE33 cells were exposed to DCA concentration and analyzed as in Fig 1. DCA concentrations in μM: C (0), 100, 200–300. Blots from 3–8 experiments were subjected to quantitative densitometry. Control at each time point was set to 1. (A) Notch1: for 4 hours: αP < .01; βP < .05; γP < .01; δP < .01. For 8 hours: *P < .01; **P < .01; #P < .01. (B) Notch3: for 2 hours: ΔP < .001; λP < .01; for 4 hours: βP < .01; #P < .05. For 8 hours: *P < .001; **P < .05; αP < .01.

